 News
News  Coin Information
  About us
  Customer Service


Bitcoin (BTC) is hovering around the mid-$60,000s after peaking near $126,000 last October, leaving the market debating whether the worst of the drawdown is already behind it—or whether history still points to a deeper capitulation. While some investors argue the bottom is close, a review of prior cycles suggests an uncomfortable possibility: a move toward the low-$30,000s remains plausible if the familiar rhythm of post-peak declines repeats.
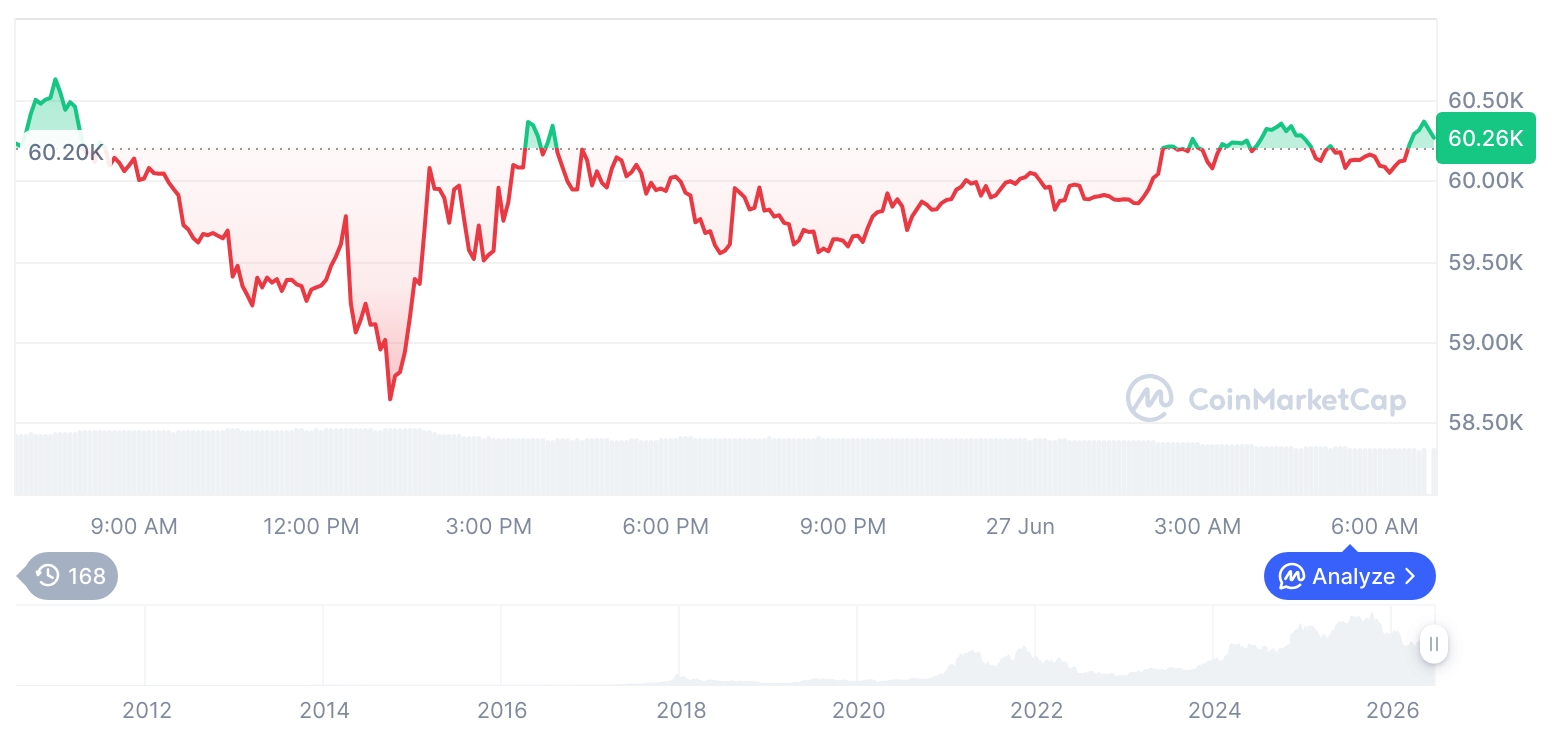
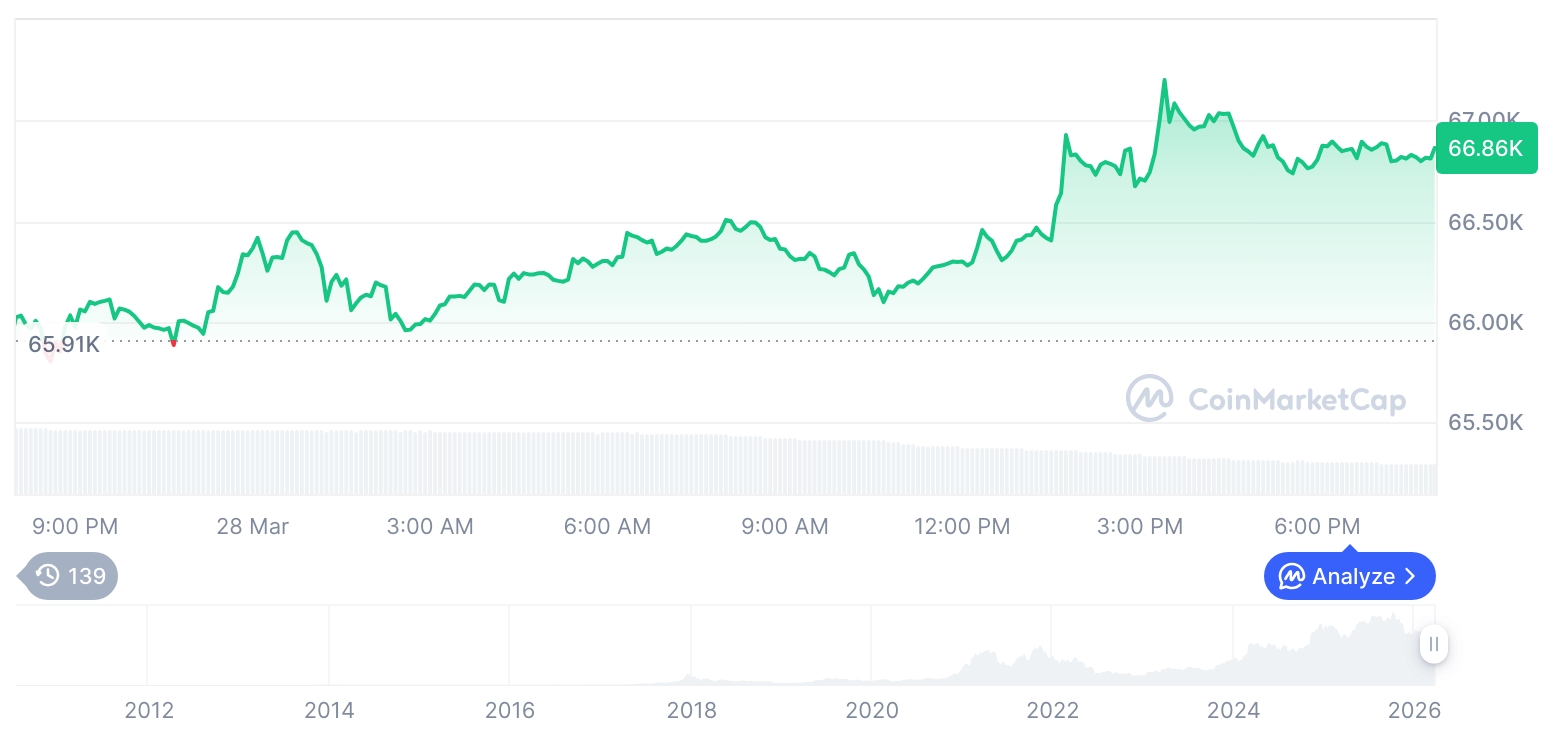
As of late March 2026, BTC has retraced roughly 46% from its all-time high, trading in the $67,000–$68,000 range. The pullback follows a cycle pattern that has appeared with notable consistency over the past three major market peaks: in 2017, Bitcoin fell about 84% from roughly $19,000 to near $3,200; in the 2021 cycle, it dropped about 77% from around $69,000 to roughly $15,476. With the 2025 peak set at $126,000, the current decline is still comparatively modest—at least so far.
Some analysts argue that each cycle’s percentage drawdown has compressed over time, implying that the next major bear-market trough might not be as severe as earlier collapses. Using that framework, projections cluster around a 70%–76% peak-to-trough decline for this cycle, which would place a potential bottom in the low-$30,000s if the market were to revisit a historically typical capitulation.
The bullish rebuttal is familiar: the market structure has changed. Advocates point to three themes—'institutional inflows,' spot ETF adoption, and the growing discussion of Bitcoin as a strategic asset. But versions of the same argument were widely cited at the 2021 top as well, when “this time is different” narratives leaned heavily on Wall Street participation.
What is meaningfully new is the presence of spot Bitcoin ETFs. Since launch, cumulative net inflows have been estimated at roughly $21 billion, with allocations increasingly appearing in retirement accounts and advisory portfolios. Supporters of the “structural bid” thesis argue these longer-duration holders have helped cushion the selloff, enabling the market to absorb declines without the kind of cascading breakdown seen in earlier cycles.
Still, the debate hinges on whether ETFs and institutional demand are strong enough to invalidate historical drawdown patterns—or simply delay them. Forecasts for a cycle bottom remain widely dispersed. CryptoQuant, for example, has pointed to Bitcoin’s 'realized price'—an on-chain metric approximating the average cost basis of the network—as a key reference. With realized price near $56,000, the firm has argued that bear-market lows have often formed around that zone, suggesting this downturn could end up being one of the shallowest on record at roughly a 55% decline from the peak.
Other technical analysts frame the $40,000–$44,000 range as a more standard correction band relative to the $126,000 high—an area that could more fully clear residual leverage and reset positioning for a new four-year cycle. More bearish scenarios also remain on the table. Hardline bears warn that if market structure “breaks” in a decisive way, a 70%+ drawdown—implying prices in the mid-$20,000s—cannot be ruled out, even if they consider it a lower-probability outcome under current conditions.
Macro forces could ultimately determine whether this cycle is merely different—or more fragile. Observers noted that during 2025’s push to fresh highs, volatility remained comparatively subdued, unlike prior bull markets where volatility typically surged alongside new records. Some interpret that as a sign the traditional four-year cycle may be evolving.
At the same time, Bitcoin’s behavior as a 'risk asset' has reasserted itself during periods of stress. Following President Trump’s tariff announcement in April 2025, analysts recorded Bitcoin’s correlation with the S&P 500 rising to about 0.73 and with the Nasdaq to around 0.76. During the large liquidation event in October 2025—estimated at roughly $19 billion—correlations reportedly climbed again, toward the high-0.7 range. The implication is straightforward: as long as BTC trades more like a high-beta macro instrument than 'digital gold,' Federal Reserve rate expectations and global liquidity conditions are likely to remain dominant drivers.
On-chain indicators offer mixed signals. One data point frequently cited is miner economics: estimates place Bitcoin’s mining electricity cost around $70,000, a level that has historically acted as a meaningful support zone. Periods when BTC trades below that threshold can coincide with miner stress and have sometimes aligned with longer-term accumulation windows—though the relationship is not deterministic and can be distorted by changes in hardware efficiency and energy markets.
For now, the market is left with competing narratives. If history rhymes, a $30,000–$35,000 scenario cannot be excluded. If the pattern breaks, ETF-driven demand and broader institutional positioning could help carve out a more durable floor in the $50,000–$60,000 range. Either way, the current environment rewards neither blind optimism nor reflexive pessimism—only careful scenario-based risk assessment as the next phase of Bitcoin’s cycle takes shape.
🔎 Market Interpretation
- Current state: Bitcoin is trading around $67,000–$68,000, down roughly 46% from the $126,000 peak (Oct 2025), leaving uncertainty over whether the drawdown is nearing completion or still mid-cycle.
- Historical rhythm vs. “new structure”: Prior cycle peak-to-trough declines were steep (~84% in 2017; ~77% in 2021). By that yardstick, the current decline is not yet a typical capitulation.
- Cycle compression thesis: Some analysts expect diminishing drawdown severity over time; a 70%–76% decline from $126,000 implies a potential trough in the low-$30,000s.
- ETF-era thesis: Spot Bitcoin ETFs are a meaningful new variable, with estimated cumulative net inflows around $21B. Proponents argue this “structural bid” may dampen forced selling and volatility compared with past cycles.
- Risk-asset behavior remains key: BTC has shown high equity correlation during stress (reported ~0.73 with S&P 500, ~0.76 with Nasdaq), suggesting macro liquidity and Fed expectations still strongly influence price.
- Mixed on-chain and cost signals: Realized price near $56,000 is presented as a potential bear-market reference. Miner electricity cost estimates around $70,000 are cited as a potential support/pressure zone, though imperfect and sensitive to energy/hardware changes.
💡 Strategic Points
- Define scenario bands (not a single target):
- Shallow bear case: приблиз. ~55% drawdown (CryptoQuant framing), with potential stabilization near realized price (~$56,000).
- Base / “standard correction” case: technical analysts highlight $40,000–$44,000 as a more typical deleveraging/reset zone versus the $126,000 peak.
- Deep capitulation case: a historically familiar 70%+ drawdown implies $30,000–$35,000; extreme bearish tail risk extends to the mid-$20,000s if market structure breaks.
- Watch ETF flow persistence, not headlines: Ongoing net inflows and “stickier” allocation channels (retirement/advisory) may reduce reflexive selling—but a slowdown or reversal could remove the cushioning effect.
- Treat correlations as a risk switch: Rising BTC-equity correlation during stress implies tighter linkage to macro shocks; risk management should account for equity drawdowns, rate surprises, and liquidity contraction.
- Use on-chain levels as references, not guarantees: Realized price and mining cost can frame potential support/pressure areas, but both can be invalidated by regime shifts (ETF liquidity, leverage, miner efficiency changes).
- Positioning mindset: The article argues for scenario-based risk assessment over “this time is different” certainty—balancing upside participation with drawdown planning.
📘 Glossary
- Drawdown: The percentage decline from a peak price to a subsequent low (peak-to-trough loss).
- Capitulation: A phase of intense selling where leveraged/weak holders exit, often associated with panic and high volume.
- Spot Bitcoin ETF: An exchange-traded fund that holds Bitcoin directly (spot), providing traditional brokerage access.
- Net inflows: Total capital entering an ETF minus capital leaving it over a period; used as a gauge of demand.
- Structural bid: Persistent demand that is less sensitive to short-term price swings (e.g., long-horizon allocators).
- Realized price: An on-chain metric approximating the network’s average cost basis by valuing coins at their last moved price.
- Residual leverage: Remaining borrowed/derivative positioning that can amplify moves and trigger liquidations.
- Four-year cycle: A commonly cited Bitcoin market pattern often linked to halving-driven supply dynamics and recurring boom-bust behavior.
- High-beta risk asset: An asset that tends to move more than the broader market during risk-on/risk-off swings.
- Liquidity conditions: The ease of obtaining funding/credit in markets; tighter liquidity often pressures risk assets.
- Miner economics / mining cost: The cost structure (notably electricity) required to mine BTC; stress can rise when price falls below costs.


Comment 0