 News
News  Coin Information
  About us
  Customer Service


Bitcoin (BTC) is struggling to reclaim ground above $76,800, with heavy overhead supply turning recent rebound attempts into short-lived rallies. Market data suggests the trading “center of gravity” has shifted lower after a sharp drop, signaling a classic post-surge ‘re-alignment’ phase in which price consolidates around a newly formed equilibrium rather than immediately resuming an uptrend.
Over the past 24 hours, BTC pushed back into the upper $77,000s before sellers defended a dense supply zone and forced a renewed sell-off. The decline accelerated toward the low $75,000s, after which Bitcoin stabilized and moved sideways in the $75,500–$76,000 band. The range-bound action reflects weakening short-term momentum, but also indicates simultaneous ‘defensive bidding’ and ‘dip-buying’ interest emerging near the lower end of the recent move.
According to a 24-hour heatmap from BitcoinCounterFlow, the thickest concentration of transactions remains clustered between $76,800 and $77,400—an area that previously functioned as a core trading region before the latest downswing. That zone has now flipped into a clear ‘overhead resistance’ band, with sell orders consistently capping rebounds as price approaches it. In contrast, the most active trading has migrated down to $75,500–$76,000, where repeated transactions following the drop are carving out a new short-term balance point.
The weekly heatmap reinforces a more structural interpretation: the $77,000–$78,000 area continues to act as a key medium-term supply region, and Bitcoin has not been able to re-establish acceptance above it since the rapid sell-off. In particular, the area around $78,000 stands out as the thickest volume node—effectively a pivot level that would need to be reclaimed to credibly shift market posture back toward a sustained recovery.
On the downside, $75,000–$75,500 is emerging as the nearest support zone, built from concentrated activity after the drop. Analysts caution, however, that a break below $75,000 could expose a ‘liquidity gap’—a relatively thinly traded region where price can slide more quickly—opening the door to a move into the low-to-mid $74,000s.
Structurally, the market appears to be undergoing ‘re-distribution’: after an earlier surge, supply accumulated near the top, and subsequent trading activity has migrated lower as the market searches for a new equilibrium. In cycle terms, this process often serves as both a cooling mechanism for short-term overheating and a staging period where the market rebuilds energy for the next trend decision.
From a near-term perspective, a box range between roughly $75,500 and $77,000 looks increasingly likely. Bulls would need a decisive break back above $77,000–$78,000 to argue for a meaningful trend reversal, while bears are watching whether $75,000 can continue to hold as the line separating consolidation from deeper downside follow-through.
At the time of measurement, Bitcoin was trading at $75,766—down about 39.89% from its prior peak of $126,038. The drawdown has widened from the previous week’s 37.89%, indicating that ‘correction pressure’ has re-intensified even as price attempts to stabilize. The ongoing pullback in the high-30% to ~40% range suggests the market is still working through elevated peak-level supply.
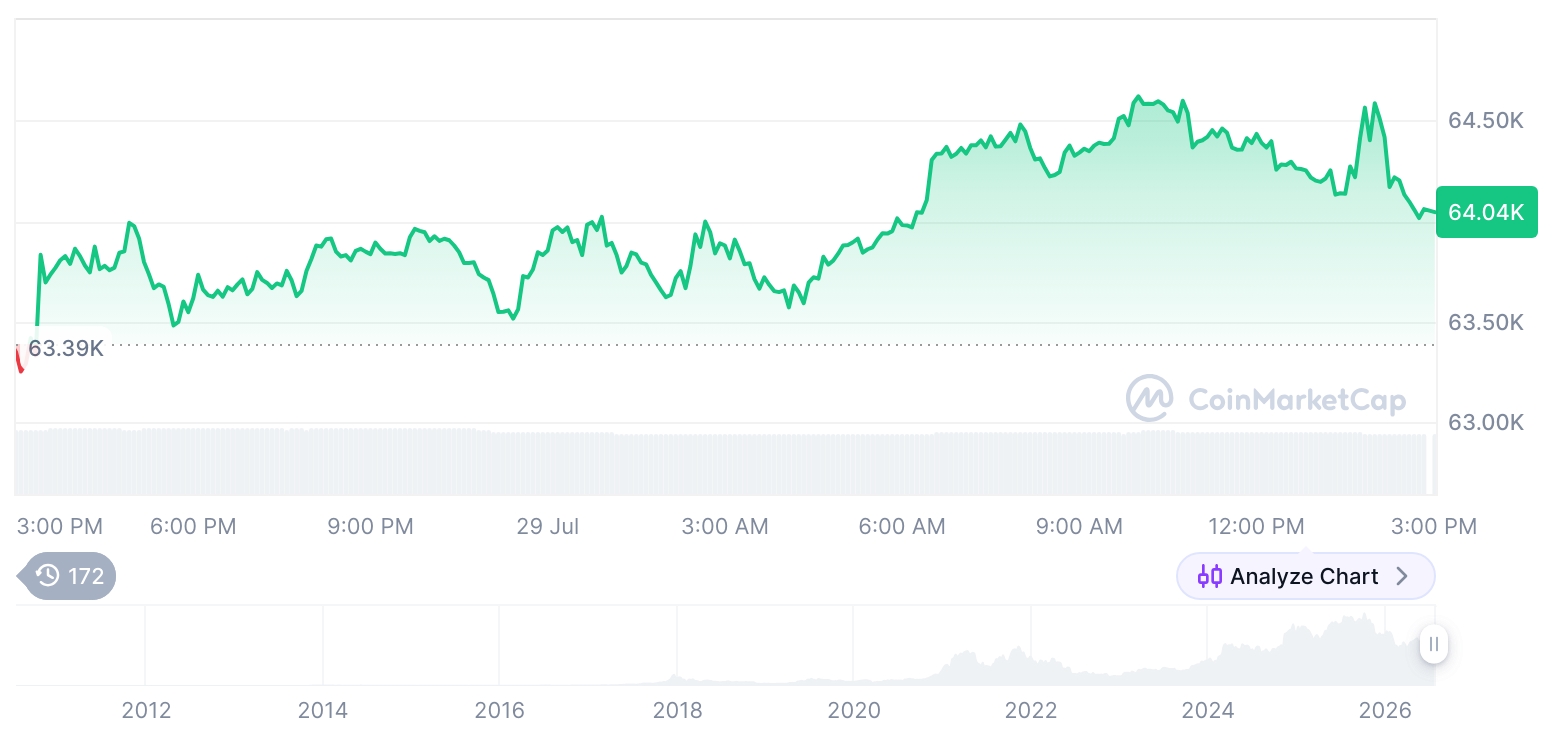
In the broader post-halving context, the report notes that 741 days after the fourth halving on April 20, 2024, Bitcoin is up around 18.66% compared with the halving-day price of $63,850. While gains remain positive, the pace has cooled, aligning with historical patterns in which BTC often trades sideways for a period after the halving before directional momentum reasserts itself.
Longer-term cycle comparisons remain constructive despite the correction. From the cycle low of $15,770 recorded on November 21, 2022, Bitcoin is still up roughly 380% after 1,257 days—supporting the view that the broader uptrend structure remains intact even as the market digests prior excess. Based on historical cycle templates cited in the analysis, the projected window for a bull-market cycle end would fall around October 21, 2026, leaving approximately 174 days in the current model’s timeline. With the cycle characterized as being in its later stages, the next several months are expected to play an outsized role in determining whether Bitcoin can re-accelerate or remains trapped in a protracted distribution and consolidation regime.


Comment 0