 News
News  Coin Information
  About us
  Customer Service


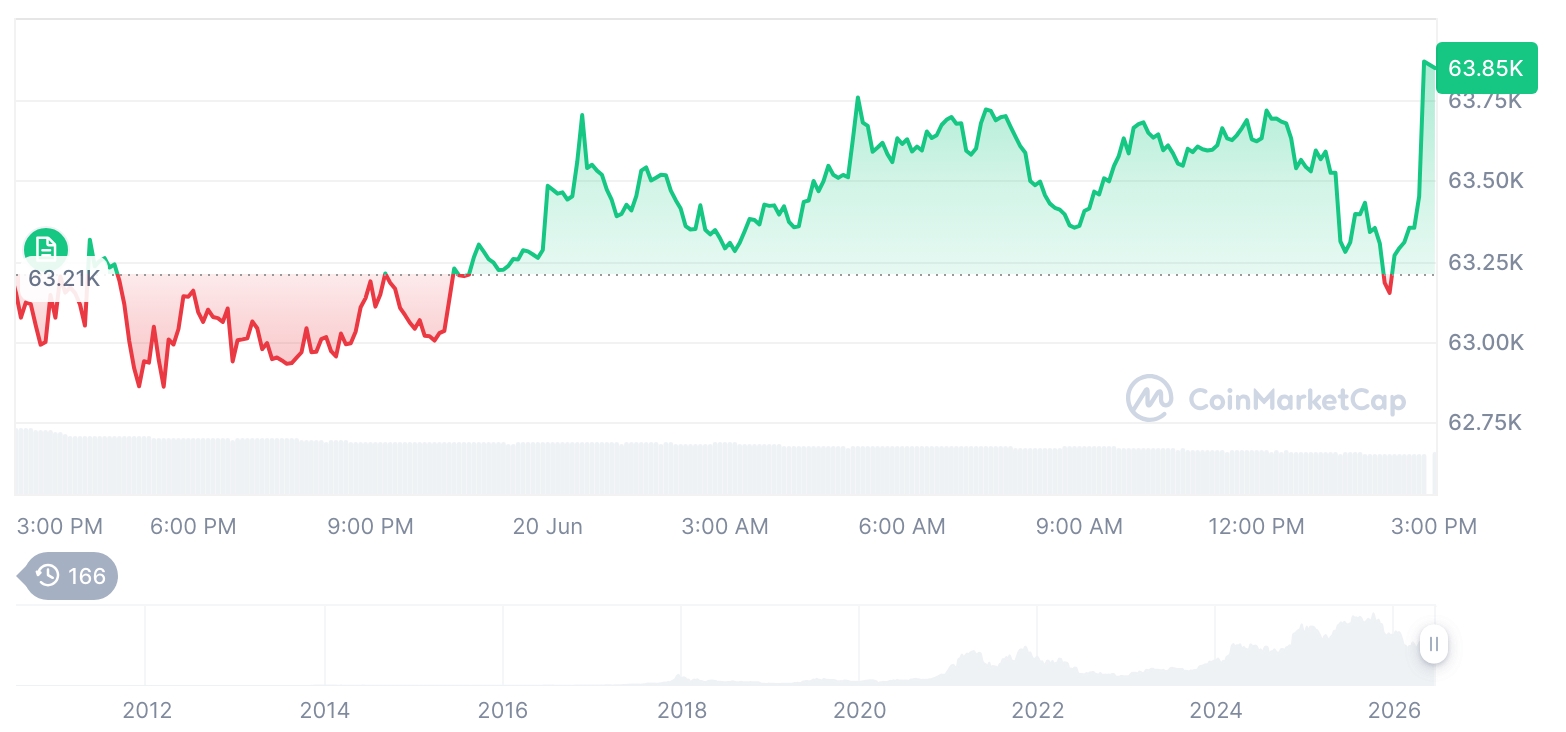
Bitcoin’s 30-day implied volatility index (BVIV) has fallen sharply to 48, breaking below a long-standing bullish trendline dating back to September. This move signals a clear reduction in market panic and suggests that BTC may continue to experience volatility compression in the near term. At the same time, renewed weakness in the US dollar index is adding bullish tailwinds, historically supporting higher bitcoin prices. Since November, the spot-volatility correlation has remained mostly negative, reinforcing the inverse relationship between BTC price action and volatility trends.
BTC has reclaimed the Friday high of $93,104 as support, pushing firmly into bullish territory above the Ichimoku cloud on the hourly chart. Traders are now watching for a bullish MACD histogram crossover that could trigger the next major upward impulse. The primary upside target remains the $98,000 to $100,000 zone, a confluence of psychological resistance and a descending trendline. However, a drop back below the Ichimoku cloud would challenge the bullish structure and indicate fading momentum.
XRP is holding steady near $2.20 after recently moving above the Ichimoku cloud, forming a solid base for a potential breakout higher. Although the hourly MACD has rolled into a bearish crossover, the lack of significant price decline highlights underlying strength. Resistance remains at $2.28 and $2.30 as buyers look for confirmation of renewed momentum.
Ether continues to build on its bullish reversal after a bear trap, reflected in two strong daily candles with minimal wicks—clear evidence of buyer control. With the daily MACD histogram turning positive, ETH appears positioned to target the October 10 low around $3,510. Short-term consolidation is possible, especially if price retests former resistance turned support at $3,100 while the hourly MACD hints at a temporary slowdown.
Solana is nearing a breakout from its consolidation range, hovering close to resistance at $144.74. A decisive breakout could open the path toward $165 based on measured move projections. Still, the hourly MACD suggests a potential pullback or extended sideways action before momentum fully shifts upward.


Comment 0