 News
News  Coin Information
  About us
  Customer Service


Ripple (XRP) is locked in a high-stakes tug-of-war near the $1.30 level, a zone traders are treating as a ‘make-or-break’ support after a steady slide from recent highs. While several leading AI models broadly agree the token is in a ‘bottom-finding’ phase, their assessments lean slightly toward further downside rather than an imminent trend reversal.
As of Sunday ET (Mar. 29), XRP was changing hands around $1.33, roughly 14% below its recent peak near $1.54. The broader technical backdrop remains heavy: XRP is trading more than 35% below its 200-day moving average (around $2.05), a widely watched gauge of longer-term trend health. That gap suggests any bounce could be ‘technical’ rather than the start of a sustained recovery unless the market can reclaim key moving averages and restore upside momentum.
Momentum indicators, however, are starting to complicate the bearish picture. XRP’s relative strength index (RSI) sits near 39—still weak, but no longer accelerating lower—hinting that sell pressure may be easing. Some model-driven readings also flag the possibility of a developing ‘momentum divergence,’ which can precede short-lived rebounds. Even so, analysts note that RSI has not fallen into a clear oversold regime below 30, meaning the market lacks a definitive capitulation-style signal that often accompanies more durable bottoms.
Among the AI assessments cited, GPT-5.2 frames the current tape as a ‘sideways base within a downtrend.’ It identifies $1.30–$1.32 as the critical support band and argues that holding this zone could allow a tactical rebound. But it also points to a sequence of lower highs and fading volume as signs that bearish control remains intact. GPT-5.2 estimates the probability of a rebound at roughly 42%, adding that a meaningful recovery scenario likely requires a break above $1.38—opening the door to $1.42–$1.45.
Claude Sonnet 4.6 takes a more cautious stance, describing XRP as sitting near the lower end of a Fibonacci retracement range—a typical area where markets ‘test the floor’ before choosing direction. It highlights an unusually sharp drop in trading activity—volume down more than 98% day-over-day in the referenced session—as a potential ‘liquidity vacuum’ that can precede abrupt moves. In Claude’s scenario analysis, the odds tilt above 50% toward additional near-term downside, with a warning that a loss of roughly $1.326 could expose the low-$1.20s and, in an extended selloff, levels near $1.117.
xAI’s Grok (4.1) is comparatively more constructive on the immediate outlook, emphasizing the approach toward oversold conditions and signs of improving volume in some windows. It assigns around a 55% chance of a rebound, with a similar upside trigger: a push through $1.385 could fuel a move toward $1.43–$1.45. Still, it also cautions that a breakdown below $1.326 could accelerate weakness—potentially dragging price swiftly back toward $1.30.
Taken together, the models converge on a two-layered message: XRP may be capable of short-term bounces, but the prevailing structure remains ‘bearish’ unless proven otherwise. In practice, that leaves the $1.30–$1.39 range as a decisive ‘box’ for near-term direction, with traders watching for either a breakout to validate a relief rally or a breakdown to confirm continuation lower.
Over the next 24 hours, the scenarios most frequently cited revolve around three paths. First, if $1.30 holds, XRP could attempt a move through $1.38 and rebound toward the low-$1.40s. Second, if $1.30 fails, downside could extend toward $1.26 and potentially into the low-$1.20s. Third, if volume remains suppressed, price may continue to drift between roughly $1.31 and $1.36 without establishing a clear trend.
Volume is emerging as the key swing factor. A sustained contraction in turnover can signal waning participation and heightened sensitivity to large orders—conditions that often precede sharper, less predictable price swings when liquidity returns. For now, XRP appears to have some ingredients for a ‘technical rebound,’ but the combination of a weakened long-term trend and thin participation leaves the market vulnerable to renewed sell pressure.
Ultimately, the immediate battleground is $1.30, while the larger dividing line remains the 200-day moving average near $2.05. Until XRP can reclaim long-term trend markers, market observers are likely to treat rallies as corrective moves within a broader downtrend rather than confirmation of a lasting reversal.
🔎 Market Interpretation
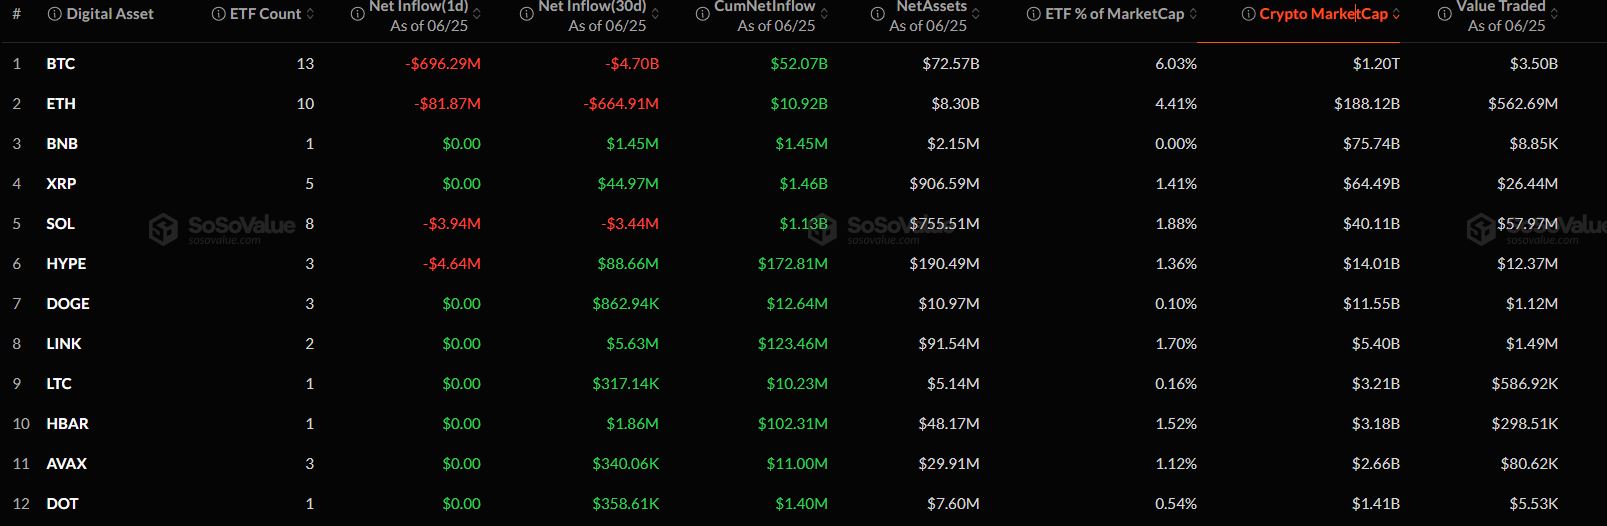
- Key battleground: XRP is hovering near $1.30–$1.32, viewed as “make-or-break” support after a slide from ~$1.54 to ~$1.33 (about -14%).
- Macro technical bias remains bearish: Price is still ~35% below the 200-day moving average (~$2.05), implying any bounce may be corrective unless long-term levels are reclaimed.
- Momentum is stabilizing, not reversing: RSI ~39 suggests weakness is easing, but the lack of an RSI dip below 30 means no clear “capitulation” signal for a durable bottom.
- Volume is the swing variable: A sharp contraction in activity (including an AI-cited session with volume down ~98% day-over-day) can create a liquidity vacuum—often leading to abrupt, volatile moves when orders return.
- Near-term “decision box”: Models converge on $1.30–$1.39 as the range that will likely determine whether XRP gets a relief rally or resumes the downtrend.
💡 Strategic Points
- Support-first scenario (relief rally): If $1.30 holds and price reclaims $1.38–$1.385, upside targets cluster around $1.42–$1.45 (a tactical rebound rather than confirmed trend reversal).
- Breakdown scenario (continuation lower): A sustained loss of ~$1.326 risks acceleration toward $1.26, then the low-$1.20s, with an extended downside reference near $1.117.
- Range/low-liquidity drift: If volume stays muted, price may chop between roughly $1.31–$1.36 without a clean directional signal—raising the odds of sudden spikes once liquidity returns.
- Model stance snapshot:
- GPT-5.2: “Sideways base within a downtrend”; rebound probability ~42%; needs $1.38 break to open $1.42–$1.45.
- Claude Sonnet 4.6: Slightly bearish tilt (>50% odds of further downside); highlights liquidity vacuum risk; warns sub-$1.326 can expose low-$1.20s and $1.117.
- Grok 4.1: More constructive near-term (~55% rebound odds); similar trigger at $1.385; still flags fast weakness if $1.326 breaks.
- Trend confirmation filter: Even if a bounce occurs, the article frames true structural improvement as unlikely until XRP starts reclaiming major moving averages—especially the 200-day MA (~$2.05).
📘 Glossary
- Support (e.g., $1.30–$1.32): A price zone where buying demand is expected to absorb selling; a break can trigger accelerated declines.
- Resistance (e.g., $1.38–$1.39): A zone where selling pressure may cap rallies; a breakout can trigger momentum-based buying.
- 200-day moving average (200D MA): A long-term trend indicator; trading well below it typically signals bearish longer-term structure.
- RSI (Relative Strength Index): Momentum oscillator (0–100). Below 50 implies weak momentum; <30 is often labeled “oversold,” though not a guarantee of reversal.
- Momentum divergence: When price makes new lows but momentum indicators weaken less (or rise), sometimes preceding a short-term rebound.
- Fibonacci retracement: A tool to identify potential support/resistance zones based on prior moves; “testing the floor” refers to price probing these levels.
- Liquidity vacuum: Extremely thin trading/low volume conditions where small order imbalances can cause outsized price swings.
- Relief rally / technical rebound: A short-lived bounce within a broader downtrend, often driven by oversold conditions or short-covering rather than a true trend change.


Comment 0