 News
News  Coin Information
  About us
  Customer Service


Solana (SOL) traded at $84.93 on Monday ET, holding its position as the crypto market’s seventh-largest asset by market capitalization, as a modest weekly rebound collided with a still-negative monthly trend. While SOL edged up 0.13% over the past 24 hours, it remains down 5.58% over the last 30 days—highlighting the uneven recovery across major Layer 1 tokens amid broader market recalibration.
As of April 20, Solana’s circulating supply stood at roughly 575.5 million SOL, giving the network a market capitalization of about $48.88 billion. Trading activity picked up notably: 24-hour volume reached $4.56 billion, up 30.25% from the prior day, suggesting renewed speculative interest and faster turnover even as conviction remains mixed.
Price action underscored that tension. SOL slipped 0.27% over the last hour, yet gained 3.83% over the past week, signaling a short-term bid returning to the market. Zooming out, however, Solana has fallen 34.04% over the past 90 days, reflecting the depth of the recent drawdown across risk assets. Against that backdrop, the token’s 60-day performance—up 4.26%—points to an emerging stabilization phase rather than a decisive trend reversal.
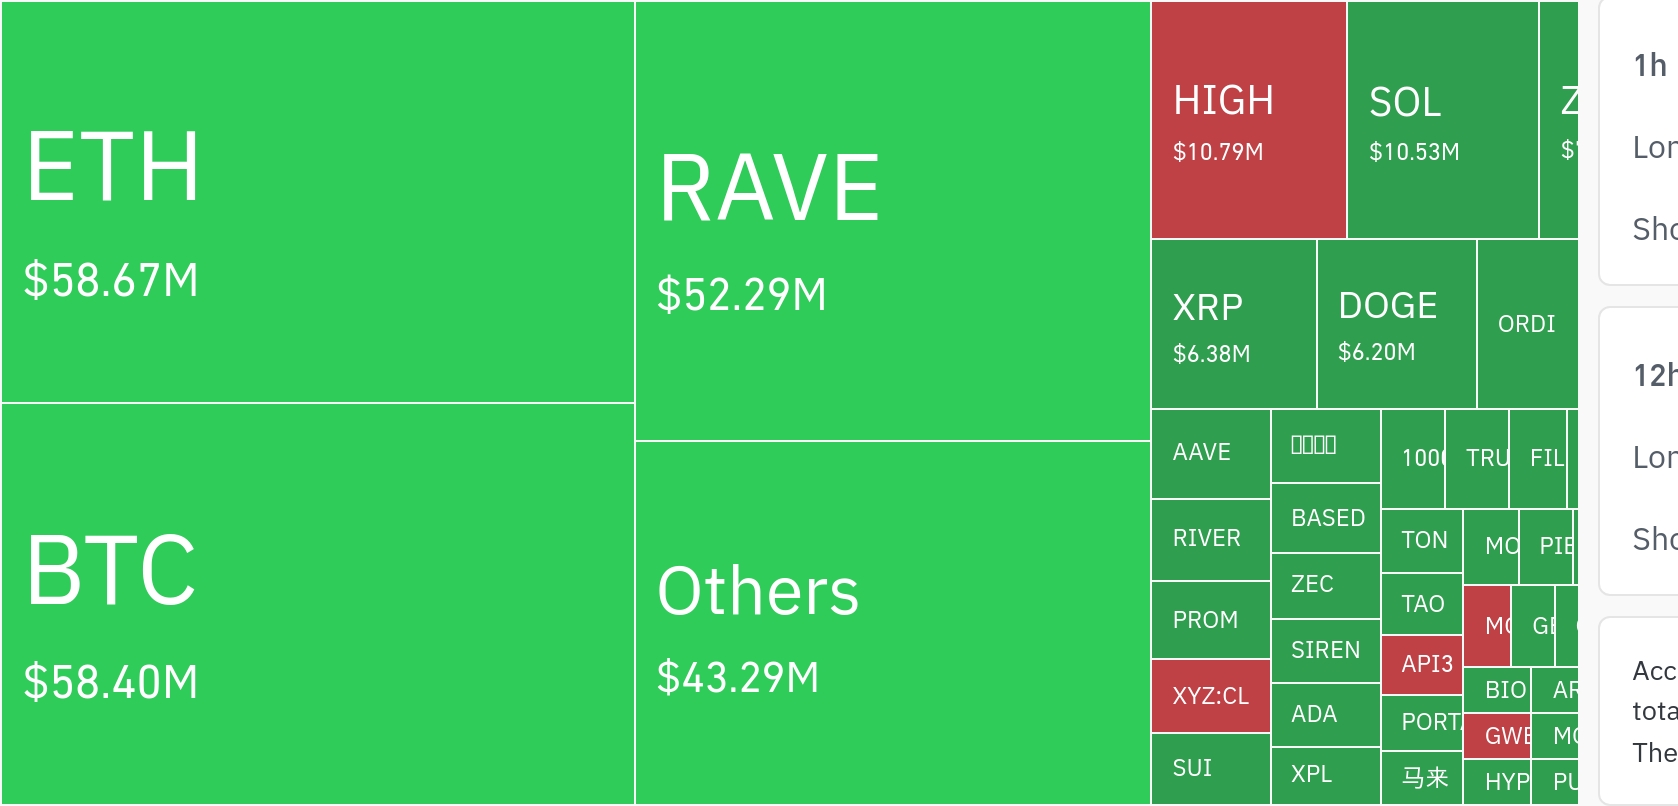
Volume breakdowns indicated that the surge was overwhelmingly concentrated on centralized venues. Centralized exchange (CEX) trading accounted for approximately $4.5636 billion of daily volume, while decentralized exchange (DEX) volume was reported at just $37,837—an unusually small figure relative to Solana’s on-chain activity and one that may reflect data coverage limitations or temporary reporting distortions. Still, the headline jump in turnover typically coincides with widening intraday ranges, reinforcing volatility as a defining feature of the current market regime.
Solana’s market dominance was estimated at 1.93%, positioning it among the small set of networks that continue to shape liquidity flows alongside Bitcoin (BTC) and Ethereum (ETH). Long viewed as an Ethereum alternative due to its high throughput and low fees, Solana remains a focal point in the Layer 1 race as investors weigh performance, developer traction, and composability against security trade-offs and macro-driven risk sentiment.
The network continues to be associated with major industry backers, including Binance-linked ecosystem participation and historical ties to groups such as Alameda Research and MultiCoin Capital. The report also referenced Solana as being categorized among assets considered for a U.S. strategic crypto reserve framework—an assertion that, if substantiated through formal policy channels, could alter perceptions of Solana’s path toward ‘institutional legitimacy’.
From a token-economics perspective, Solana operates under a Proof-of-Stake (PoS) model and does not have a hard-capped maximum supply. That ‘uncapped supply’ structure can raise inflation concerns, particularly during periods of subdued demand, though supporters argue that long-term adoption and network usage are more decisive drivers of value accrual. The fully diluted market capitalization was cited at approximately $53.07 billion—about 8.5% above the current market cap—implying limited but still meaningful dilution over time depending on issuance dynamics.
For traders, the immediate setup remains defined by crosscurrents: a weekly climb that suggests near-term momentum, counterbalanced by persistent monthly and quarterly weakness that signals lingering uncertainty. Elevated volume indicates heightened attention, but it can also amplify downside risk when positioning becomes crowded or macro conditions turn.
Looking ahead, Solana’s trajectory is likely to hinge on whether the ecosystem can sustain developer activity, attract new applications, and demonstrate consistent network performance at scale. In an environment where capital is increasingly selective, Solana’s ability to differentiate itself in the Layer 1 competition—alongside any meaningful improvement in broader crypto market sentiment—will be central to determining whether the current rebound develops into a more durable recovery.
🔎 Market Interpretation
- Mixed timeframe signals: SOL traded around $84.93, up slightly on the day (+0.13%) and positive on the week (+3.83%), but still down over 30 days (-5.58%) and sharply weaker over 90 days (-34.04%), reflecting a rebound attempt inside a larger drawdown.
- Volume spike suggests renewed speculation: 24h volume rose to $4.56B (+30.25% day-over-day), implying faster turnover and higher short-term participation—often associated with wider intraday price ranges.
- Stabilization, not confirmation: The reported +4.26% over 60 days contrasts with the 90-day decline, framing current action as an early stabilization phase rather than a confirmed trend reversal.
- Liquidity position remains meaningful: With ~$48.88B market cap and ~1.93% market dominance, Solana remains a major Layer 1 liquidity venue behind the largest networks (e.g., BTC/ETH), keeping it relevant in broad market rotations.
- CEX-heavy trading footprint: The day’s turnover was overwhelmingly on centralized exchanges (~$4.5636B), while DEX volume was cited as $37,837, a discrepancy the article notes may reflect reporting limitations or distortions rather than true on-chain inactivity.
💡 Strategic Points
- Trading setup is defined by crosscurrents: Weekly momentum can support tactical longs, but persistent monthly/quarterly weakness argues for tighter risk controls and awareness of “bear-market rally” dynamics.
- Use volume as a volatility signal, not only confirmation: Rising volume can validate interest, but it can also increase downside risk if positioning becomes crowded or macro sentiment deteriorates.
- Monitor venue/flow quality: If CEX dominance persists while DEX data remains unusually low, traders should verify liquidity conditions across venues and treat DEX figures as potentially incomplete.
- Fundamental catalysts to watch: The article flags that trajectory likely depends on developer activity, new application growth, and consistent network performance at scale—key drivers for sustained demand beyond speculative turnover.
- Token supply considerations matter in softer demand regimes: Solana’s uncapped supply under PoS can raise inflation/dilution concerns when demand is muted; assess issuance and staking dynamics alongside price action.
- Policy/credibility narrative is optional but impactful: Mention of potential consideration in a U.S. strategic crypto reserve framework is framed as unconfirmed; if substantiated, it could alter perceived institutional acceptance and risk premia.
- Dilution headroom appears moderate: Fully diluted market cap (~$53.07B) sits about 8.5% above current market cap, indicating limited-but-real additional supply impact depending on issuance over time.
📘 Glossary
- Market Capitalization (Market Cap): Token price × circulating supply; a snapshot of a network’s current market value.
- Circulating Supply: The amount of tokens currently available in the market (here ~575.5M SOL).
- 24h Volume: Total value traded over the last 24 hours; often used as a proxy for liquidity and trader activity.
- Market Dominance: A crypto asset’s share of total crypto market cap; used to gauge relative market influence.
- Layer 1 (L1): A base blockchain network (e.g., Solana, Ethereum) on which applications and tokens are built.
- CEX vs DEX: Centralized exchanges (custodial order-book venues) vs decentralized exchanges (on-chain trading via smart contracts).
- Proof-of-Stake (PoS): Consensus mechanism where validators stake tokens to secure the network and earn rewards.
- Uncapped Supply: A token model without a fixed maximum supply, which can introduce ongoing issuance and potential inflation.
- Fully Diluted Valuation (FDV): Market cap assuming all potential tokens are in circulation; helps estimate dilution risk.
- Drawdown: The peak-to-trough decline over a period (e.g., SOL’s 90-day drop cited in the article).


Comment 0