 News
News  Coin Information
  About us
  Customer Service


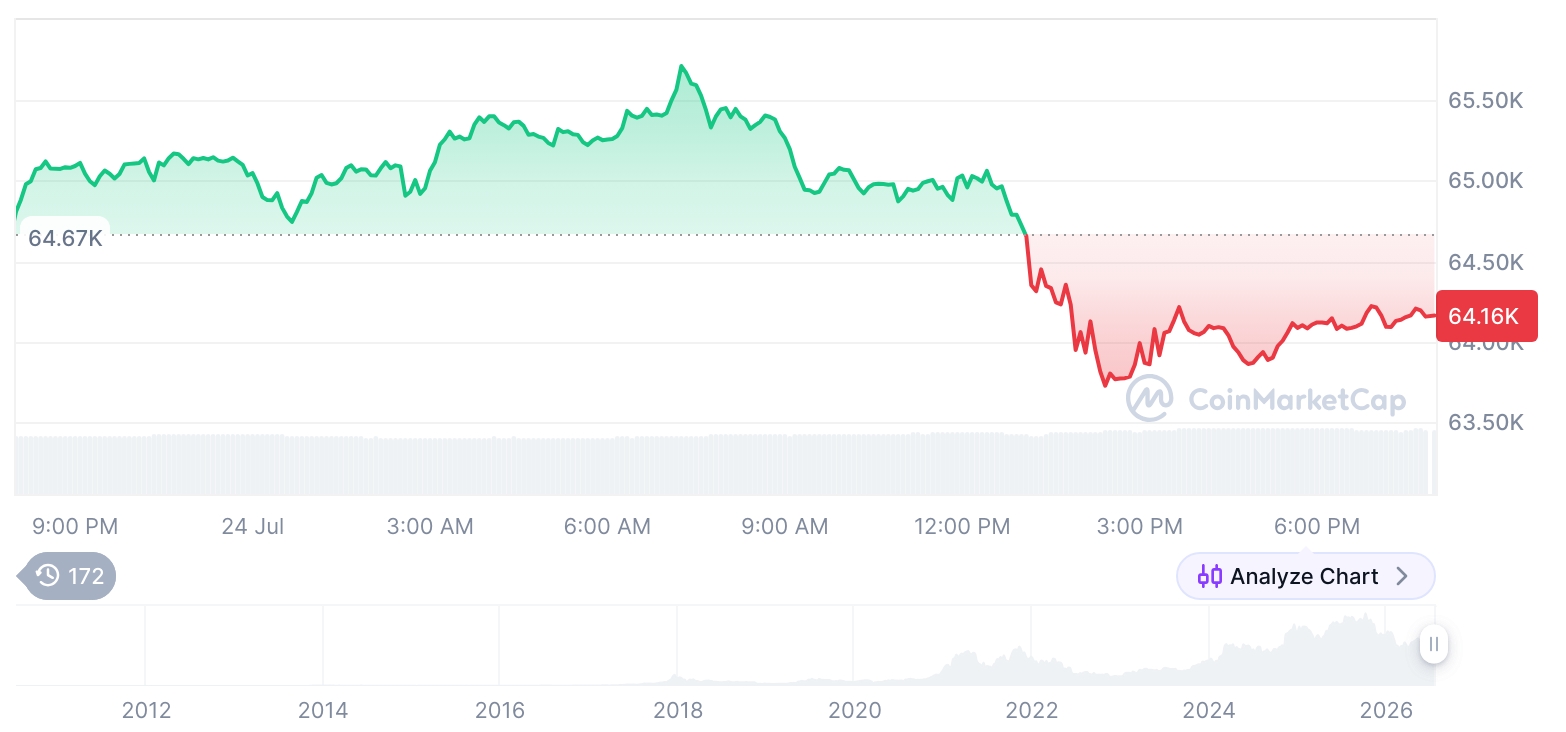
XRP (XRP) is trading in a tight range around $1.43, setting up what technical analysts say could be a decisive move within the next 48 hours as volatility compresses and key levels come into focus.
As of Saturday, April 25 in U.S. Eastern Time, XRP was priced at $1.4342, oscillating between roughly $1.43 and $1.44. Spot trading volume over the past 24 hours was about $2.045 billion, down 16.96% from the prior day—an indication of waning short-term participation as traders wait for confirmation. XRP’s market capitalization stood near $88.47 billion, keeping it the fourth-largest cryptocurrency by market value.
On-chain analyst Bird said XRP’s 4-hour chart is forming a tightening 'wedge' pattern, a setup that often precedes a breakout as price action narrows. According to the analyst, the most likely window for a directional resolution sits later on April 25, with $1.45 emerging as the immediate resistance zone. Sellers have repeatedly defended that level, suggesting that a clean push through it could be required to unlock upside momentum.
Another widely followed analyst, Ali Martinez, pointed to a 'symmetrical triangle' on the 1-hour chart—a consolidation structure that can signal continuation when it breaks. Martinez estimated the pattern implies a potential move of roughly 10%, which would place a short-term target near $1.58 if a bullish break occurs.
Recent performance data underscores the market’s mixed positioning. XRP is up 2.28% over the last 30 days and 6.43% over 60 days, reflecting a gradual recovery. Over 90 days, however, it remains down 24.69%, suggesting the broader drawdown from prior highs has not fully healed and leaving the asset sensitive to shifts in risk appetite.
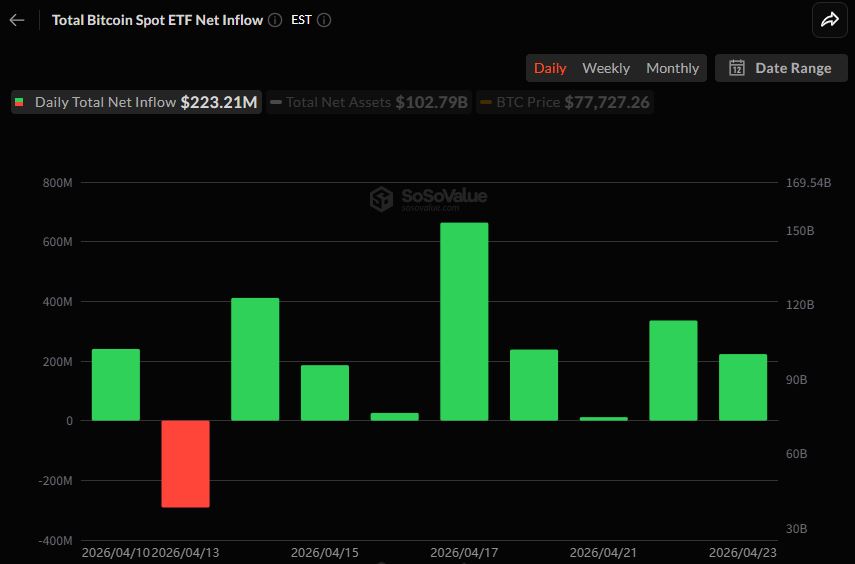
Beyond chart signals, the strongest tailwind highlighted by market participants is accelerating demand through spot exchange-traded funds. In April, seven XRP spot ETFs recorded combined net inflows of $71 million, the largest monthly total so far in 2026. Notably, inflows have continued uninterrupted for two consecutive weeks following April 9, with no single day of net outflows reported over that stretch.
Since their launch in November 2025, cumulative net inflows across the seven products have reached approximately $1.28 billion. Analysts interpret the steady pace of allocations as a sign of strengthening 'institutional demand', especially as XRP products become easier to access through regulated brokerage channels.
Regulation is also being framed as an increasingly important variable. The U.S. Securities and Exchange Commission (SEC) and the Commodity Futures Trading Commission (CFTC) have officially classified XRP as a 'digital commodity', which market observers say reduces lingering uncertainty around its legal status. In turn, the classification is seen as supportive of broader institutional participation and potential product expansion in the ETF market.
Attention is also on Capitol Hill, where the proposed CLARITY Act—legislation aimed at defining digital-asset market structure—is expected to enter a Senate markup process before May 21. Some analysts argue that a constructive outcome could materially increase ETF inflows, with projections in the market suggesting monthly demand could potentially double from current levels if regulatory pathways become more explicit.
Looking further out, many market commentators are clustering around a 2026 price target near $2.05, implying roughly 44% upside from current levels. At the same time, estimates of fully diluted value place XRP near $143.4 billion, highlighting that expectations for large additional gains will likely depend on sustained growth in utility and inflows rather than sentiment alone.
More bullish forecasts—some calling for a long-term move above $10—continue to circulate, typically citing improving regulatory clarity, expanding ETF participation, and broader adoption in global payments. Still, XRP’s path remains exposed to macro volatility, interest-rate conditions, and evolving U.S. policy, factors that can quickly reshape liquidity and risk positioning across the crypto market.
XRP’s circulating supply is about 61.684 billion tokens, roughly 61.7% of its 100 billion maximum. With a technical inflection point approaching and ETF flows strengthening, traders are watching closely for a break from the current range that could set the tone for the next phase of price discovery.
🔎 Market Interpretation
- Current state: XRP is consolidating tightly around $1.43–$1.44 (reported at $1.4342), with traders anticipating a potential 48-hour decision point as volatility compresses.
- Participation signal: 24h spot volume fell to $2.045B (-16.96%), consistent with a “wait-for-confirmation” market where liquidity thins ahead of a breakout.
- Key technical structures: A tightening wedge on the 4-hour chart and a symmetrical triangle on the 1-hour chart both suggest a breakout setup as the trading range narrows.
- Immediate pivot level: $1.45 is framed as near-term resistance; repeated defenses imply a clean break may be needed to shift momentum bullish.
- Implied move size: The triangle projection cited suggests ~10% directional move; a bullish resolution implies a short-term area near $1.58.
- Trend context: Performance is mixed—+2.28% (30D), +6.43% (60D), but -24.69% (90D)—indicating a recovery attempt that remains vulnerable to risk-off shifts.
- Macro/structure overlay: The market is increasingly focused on ETF flows and regulatory clarity as primary drivers, potentially overtaking pure chart momentum in importance.
💡 Strategic Points
- Breakout confirmation framework: Watch for a decisive move out of the range, with $1.45 as the key “line in the sand.” A breakout without volume improvement may be more prone to reversal.
- Scenario mapping:
- Bull case: Clean clearance of $1.45 aligns with the ~10% technical projection toward ~$1.58, especially if volume re-expands.
- Base case: Continued compression suggests traders may remain sidelined until a catalyst (ETF flow acceleration or policy headlines) resolves direction.
- Risk case: Given the -24.69% (90D) drawdown backdrop, a failed breakout or macro tightening (rates/liquidity) could quickly unwind short-term optimism.
- ETF flow tailwind: April saw $71M net inflows across seven spot XRP ETFs (largest monthly total in 2026), with two weeks of uninterrupted inflows since April 9—supporting the “sticky demand” narrative.
- Institutional access angle: Cumulative net inflows since Nov 2025 total ~$1.28B, reinforcing that regulated channels can stabilize demand compared with purely retail-led flows.
- Regulatory catalyst watch: XRP being classified by the SEC/CFTC as a “digital commodity” is positioned as a de-risking factor for institutions; the proposed CLARITY Act and its expected Senate markup before May 21 could further affect allocations.
- Forward expectations vs. requirements: A commonly cited 2026 target near $2.05 implies ~44% upside from current levels; the article indicates larger gains likely require sustained utility growth + continued inflows, not sentiment alone.
- Supply/valuation framing: Circulating supply is ~61.684B (about 61.7% of max 100B), and fully diluted valuation estimates near $143.4B highlight that upside narratives must be supported by durable demand expansion.
📘 Glossary
- Volatility compression: Period where price swings narrow; often precedes a larger move as the market “stores energy.”
- Wedge pattern: Converging trendlines that signal tightening price action; can break up or down, often with a sharp move.
- Symmetrical triangle: Consolidation where highs fall and lows rise; typically resolves with a breakout that can mirror the prior trend or trigger a reversal.
- Resistance: Price zone where selling pressure has historically outweighed buying, frequently halting advances (here, $1.45).
- Spot trading volume: Value traded on spot markets over a period; declining volume can indicate reduced conviction or participation.
- Spot ETF inflows: Net capital entering an exchange-traded fund that holds the underlying asset; sustained inflows can support price via incremental demand.
- Net inflow / net outflow: Net capital added to/removed from a product over a time window (inflows minus outflows).
- Market capitalization: Price × circulating supply; used to compare relative size of crypto assets.
- Fully diluted valuation (FDV): Price × maximum supply; a valuation lens that includes tokens not yet in circulation.
- Digital commodity classification: Regulatory framing suggesting the asset is treated more like a commodity than a security, potentially reducing compliance uncertainty for institutions.
- CLARITY Act: Proposed U.S. legislation intended to define digital-asset market structure and regulatory jurisdiction, which could influence product approvals and capital allocation.


Comment 0