 News
News  Coin Information
  About us
  Customer Service


Ripple (XRP) is treading water near the $1.40 level as trading activity fades, leaving the token stuck in a narrow range and amplifying uncertainty over its next move. Several leading AI models broadly agree that XRP is in a post-bounce ‘directional vacuum’ within a larger downtrend—an environment where low conviction price action can quickly flip on a single catalyst such as volume returning to the market.
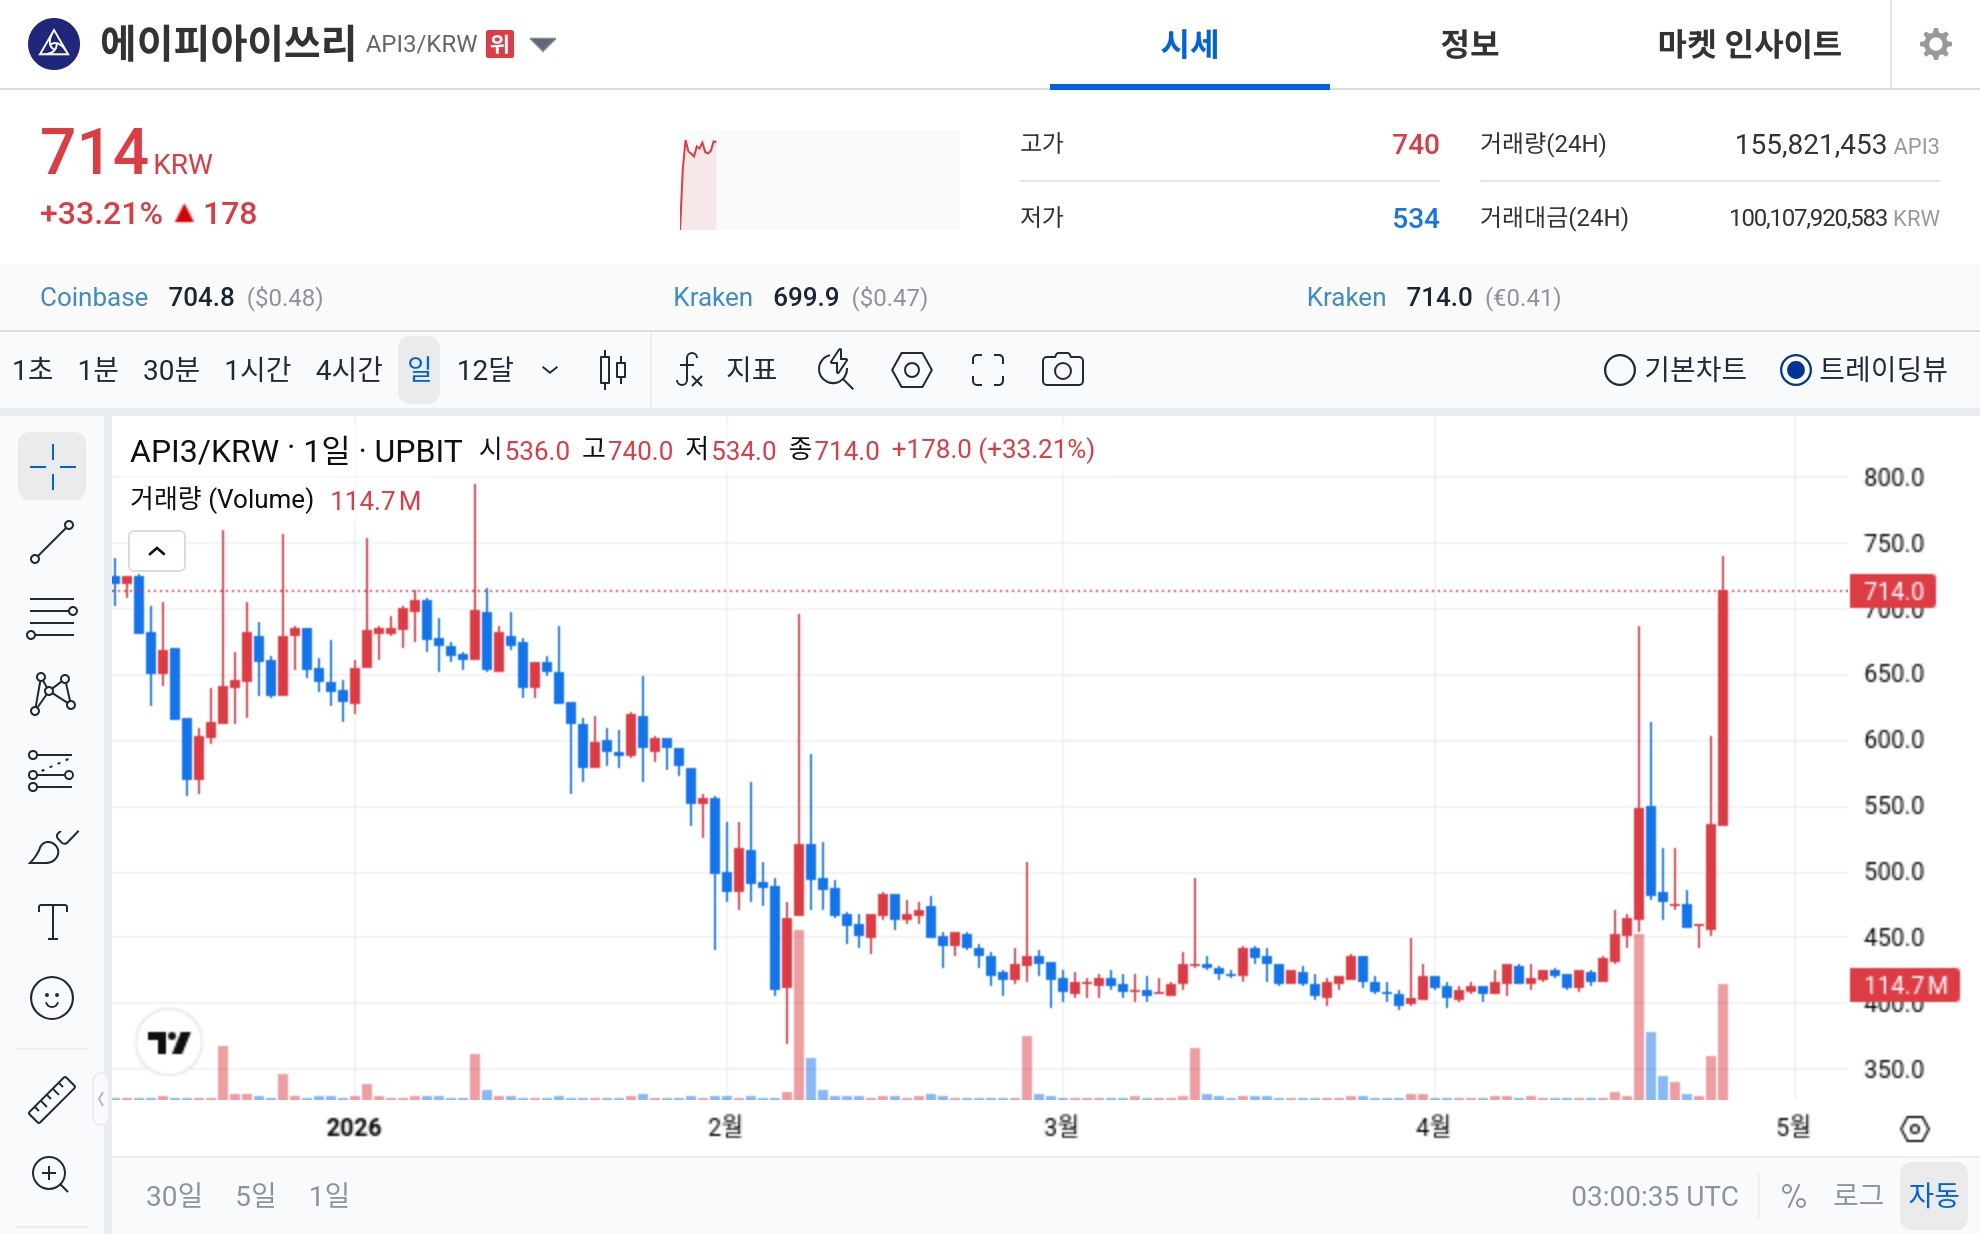
As of Saturday U.S. Eastern Time (ET), XRP was changing hands around $1.42, with the relative strength index (RSI) near 54—squarely in neutral territory. The absence of overbought or oversold readings suggests the market is not stretched, but it also underlines a lack of meaningful momentum. Analysts tracking the move say the sharp contraction in trading volume is the dominant variable: without renewed participation, breakouts tend to be fragile and false signals more common.
From a trend-structure perspective, the backdrop remains tilted bearish. XRP continues to trade below its 200-day moving average, estimated around $1.83, reinforcing the view that the broader market regime is still in a medium-to-long-term decline. The token has also failed to reclaim key Fibonacci retracement zones, a technical marker many traders use to judge whether a rebound is evolving into a durable reversal. In other words, even if prices grind higher in the short run, the move may still fall short of signaling a structural trend change.
Against that backdrop, AI-driven outlooks have converged on two near-term inflection points: ‘support’ around $1.38 and ‘resistance’ around $1.45. A clean break above resistance could encourage momentum traders to re-engage, while a loss of support risks turning thin liquidity into an accelerant to the downside.
In a probability-based scenario analysis, GPT-5.2 characterized the current zone as range-bound and neutral, assigning a 57% likelihood to a short-term rebound. It projected that a confirmed move above $1.45 could open a path toward $1.48–$1.52. However, it warned that a slip below $1.38 could quickly expand downside risk toward $1.34–$1.32 as stop-losses and weak bids compound the move.
Claude Sonnet 4.6 was more cautious, putting greater emphasis on liquidity conditions than on price levels alone. It argued that shrinking volume is a bigger problem than the chart pattern itself, and viewed continued consolidation between $1.40 and $1.45 as the most likely outcome. Claude placed the rebound probability at 45%, contending that rallies without a meaningful volume recovery tend to fade because ‘follow-through’ demand remains absent.
xAI 4.1 delivered a mixed reading. It noted signs of residual buyer advantage in order-flow dynamics, but interpreted the recent volume collapse as a potential short-term bearish trigger. In its framework, a breakdown below roughly $1.422 increases the odds of a retest near $1.325, while the rebound probability was estimated at 55%—higher than Claude’s, but still conditional on renewed participation.
Taken together, the models depict XRP in a state of ‘neutrality inside weakness’: the broader trend points down, but the immediate price action is indecisive and tightly constrained. For traders and market watchers, the $1.38–$1.45 range has become the key battleground, with the next directional move likely hinging on whether volume returns alongside price.
Over the next 24 hours, the AI frameworks broadly reduce the market to three scenarios: (1) a break above $1.45 triggering a move toward roughly $1.48–$1.50; (2) a loss of $1.38 accelerating declines into the low $1.30s; or (3) continued low-volume chop that keeps XRP pinned in the $1.40–$1.45 band.
The common denominator across all three outlooks is trading volume. Until liquidity improves, XRP may remain vulnerable to abrupt swings and short-lived breakouts, with technical levels doing more of the heavy lifting than conviction-based positioning. The AI-generated projections cited in this report are informational and do not constitute a recommendation to buy or sell any asset; in periods of heightened short-term volatility, prices can and do move sharply against forecasts.
🔎 Market Interpretation
- Current price/condition: XRP is hovering near $1.40–$1.42 amid fading participation, signaling a tight, low-conviction range.
- Momentum gauge: RSI ~54 sits in neutral territory, implying no strong overbought/oversold pressure and reinforcing the lack of directional momentum.
- Primary driver: The dominant factor is a sharp contraction in trading volume; in thin liquidity, breakouts are more prone to false signals and abrupt reversals.
- Trend regime: Despite the recent bounce, XRP remains in a broader bearish structure, trading below the 200-day moving average (~$1.83) and failing to reclaim important Fibonacci retracement zones.
- Key battleground: AI models converge on a near-term range defined by support ~$1.38 and resistance ~$1.45, where the next directional move is likely to form.
💡 Strategic Points
- Level-driven roadmap (24-hour framing):
- Bull trigger: A clean break and hold above $1.45 may attract momentum participation and target $1.48–$1.50 (with upside bands cited up to $1.52).
- Bear trigger: A break below $1.38 can turn thin liquidity into downside acceleration, with risk zones cited near $1.34–$1.32 (and a deeper retest framework near $1.325).
- Base case: Continued low-volume chop keeps XRP pinned in $1.40–$1.45.
- Model consensus: “Neutrality inside weakness”—short-term indecision within a medium/long-term bearish backdrop.
- Probability snapshots (informational):
- GPT-5.2: 57% rebound bias if $1.45 is confirmed; warns of faster drawdowns if $1.38 fails.
- Claude Sonnet 4.6: More liquidity-focused; favors consolidation; rebound probability around 45% without meaningful volume recovery.
- xAI 4.1: Mixed order-flow read; rebound probability ~55% but flags volume collapse as a bearish trigger; watches breakdown dynamics near $1.422.
- Execution emphasis: In this setup, volume confirmation matters as much as price levels; moves without participation are more likely to fade.
- Risk reminder: Thin liquidity can amplify stop-loss cascades and cause sharp moves against forecasts; the projections cited are not investment advice.
📘 Glossary
- RSI (Relative Strength Index): A momentum oscillator (0–100). Values near ~50 often indicate neutral momentum; high/low extremes can signal overbought/oversold conditions.
- Trading volume: The amount of an asset traded over a period. Falling volume often implies weaker conviction and can increase the likelihood of failed breakouts.
- Support / Resistance: Price areas where buying (support) or selling (resistance) historically intensifies, often acting as decision points for the next move.
- 200-day moving average (200D MA): A long-term trend indicator. Trading below it is commonly interpreted as a bearish regime until reclaimed.
- Fibonacci retracement: A tool that marks potential reversal/decision levels based on prior moves; inability to reclaim key retracements can suggest a rebound lacks structural strength.
- Range-bound: Price oscillating within a defined band (here, roughly $1.38–$1.45) without establishing a clear trend.
- Order flow: The real-time balance of buy/sell pressure inferred from trades and liquidity; can hint at who is controlling the tape in the short term.
- Stop-loss cascade: A rapid move triggered when clustered stop orders activate, often worsening price swings in thin liquidity.


Comment 0