 News
News  Coin Information
  About us
  Customer Service


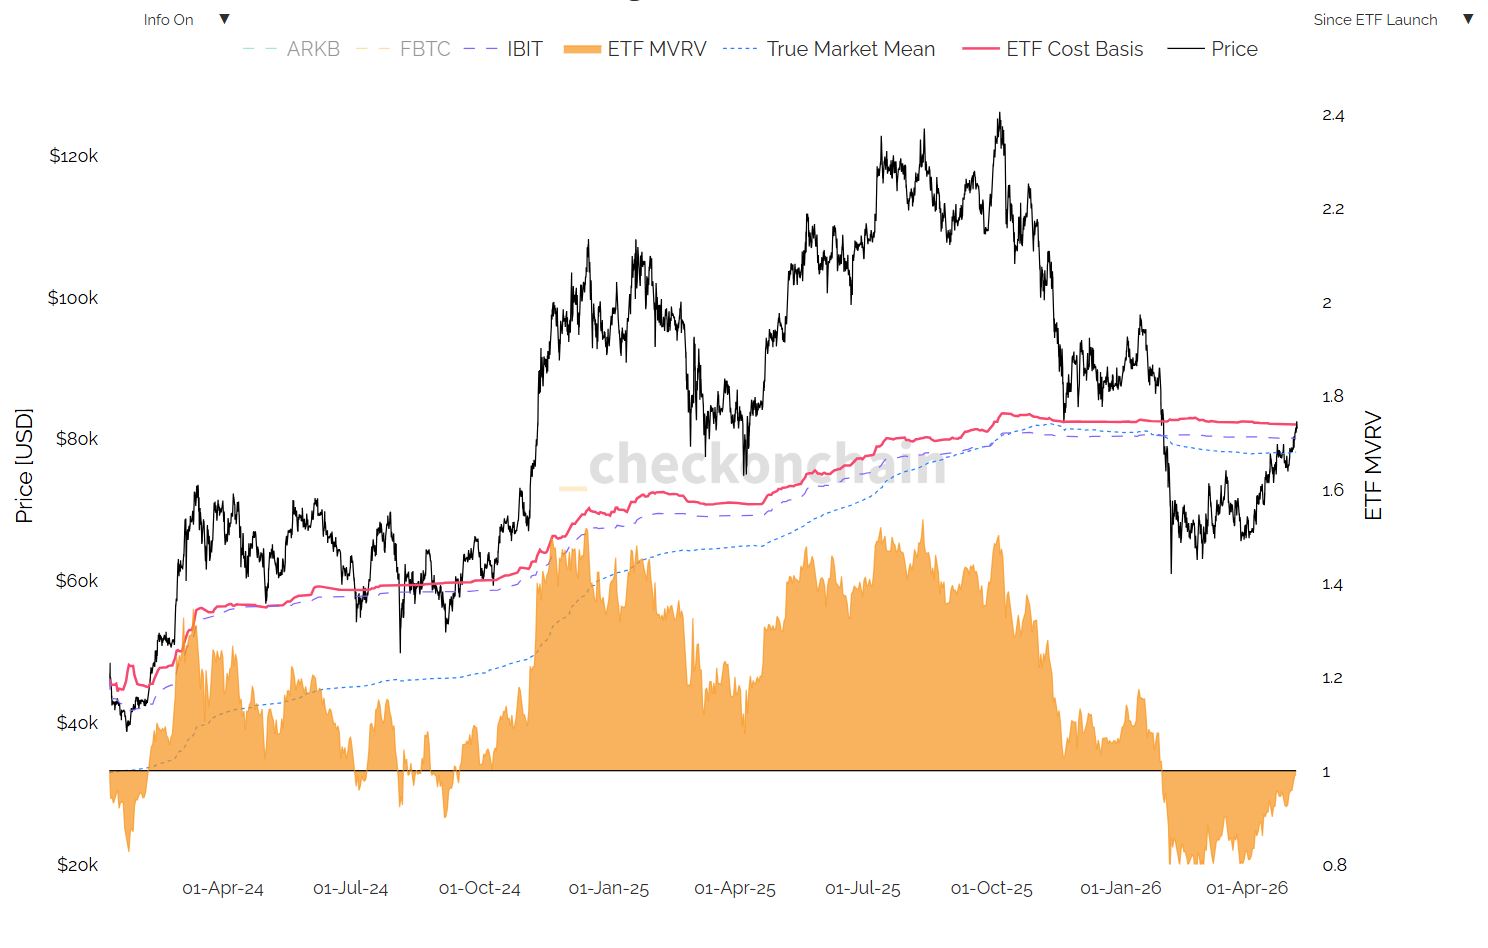
Bitcoin (BTC) spot ETF investors in the U.S. have effectively “caught up” to the market after enduring their deepest paper losses since launch, with on-chain data showing the cohort’s average cost basis now sitting near $82,000—roughly in line with BTC’s current trading range.
As of Wednesday ET, Bitcoin was changing hands around the $82,000 level. The rally has been steady rather than explosive: on Tuesday ET, BTC briefly reached $82,305, marking its highest level since Jan. 31, and has gained about 5.4% over the past five days. On a weekly basis, Bitcoin is up roughly 6%, with traders pointing to easing Middle East tensions and renewed expectations that the Federal Reserve could begin cutting interest rates as factors supporting risk appetite.
The more consequential story, however, has been investor behavior inside spot ETFs. Charts tracking MVRV—short for ‘market value to realized value,’ a measure often used to gauge whether holders are collectively sitting on unrealized profits or losses—show that earlier this year the metric fell below 1 for the ETF investor base, indicating the group as a whole was under water. That drawdown followed a prolonged slide from Bitcoin’s prior cycle peak near $126,000 on Oct. 12, 2025, to around $60,000 in February.
Despite the severity of those unrealized losses, ETF investors largely resisted capitulation. Market participants see that lack of forced selling as a signal of growing institutional discipline in Bitcoin exposure—particularly because ETF flows tend to reflect portfolio decisions at asset managers, wealth platforms, and other traditional finance channels rather than the faster-turning positioning often associated with crypto-native traders.
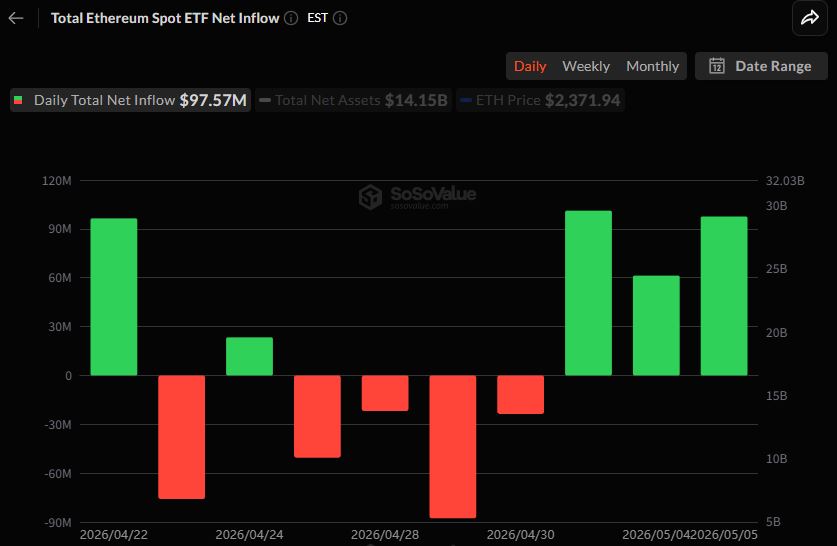
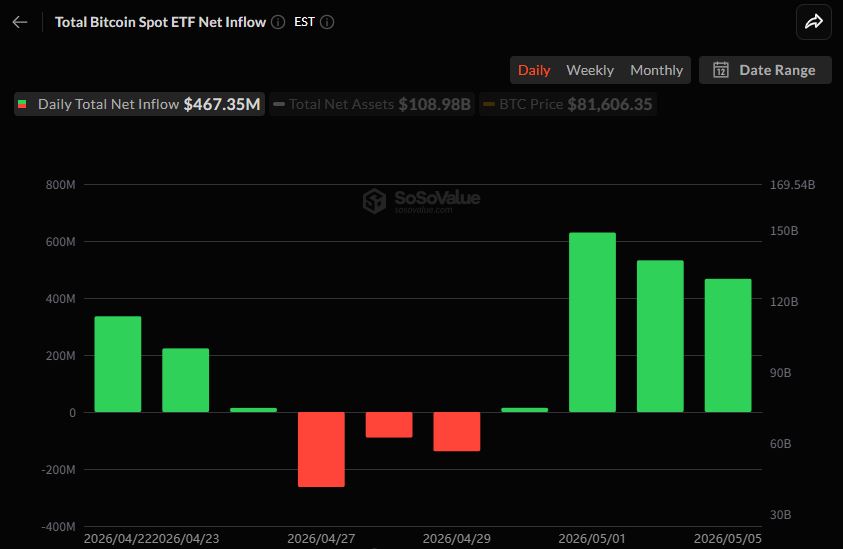
Flow data adds weight to that interpretation. By May 4 ET, U.S. spot Bitcoin ETFs recorded more than $530 million in net inflows, extending a streak of three consecutive sessions of institutional buying. The scale of inflows has also helped push ETF activity to what some analysts described as the strongest monthly pace recorded so far in 2026, a pattern increasingly read as a re-entry signal from large allocators after a period of risk reduction.
Within the industry, a growing view is that this cycle’s ‘true long-term holders’ may not be early crypto OGs, but rather traditional investors who entered via regulated ETF products—and then held through the largest unrealized-loss phase since those funds launched. If sustained, that behavior could gradually reshape Bitcoin’s holder composition toward longer-duration capital, potentially dampening the kind of reflexive selling that has historically amplified drawdowns.
From a technical standpoint, Bitcoin remains above its 20-day moving average near $77,461 and its 50-day moving average near $74,951, preserving a constructive medium-term structure. The market’s next hurdle is the 200-day moving average around $83,168, which BTC has not yet reclaimed. Traders are watching that level as a key resistance zone that could determine whether the current advance extends—or stalls into consolidation.


Comment 0