 News
News  Coin Information
  About us
  Customer Service


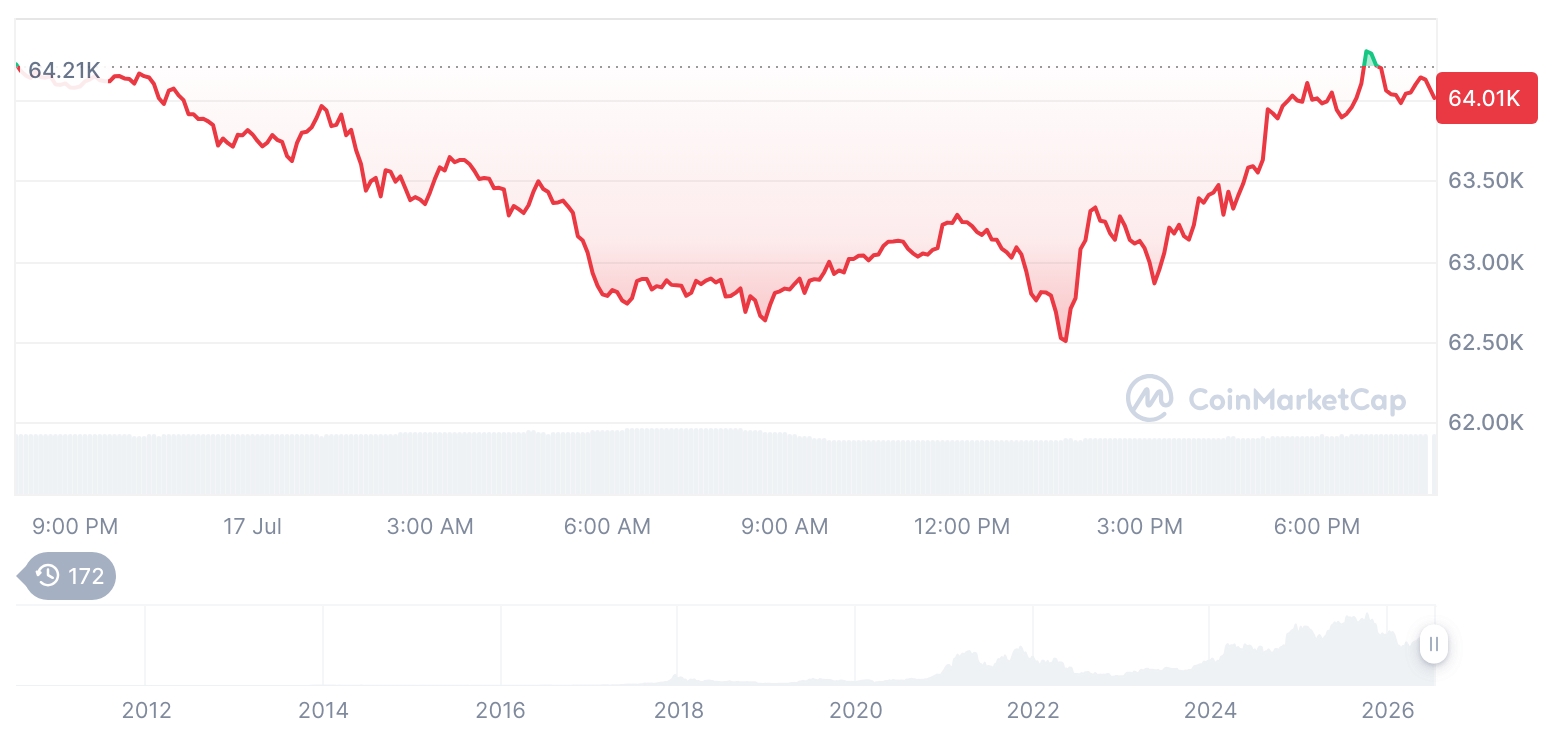
Solana (SOL) is coming under renewed selling pressure after breaking below the closely watched $75 level, a move that traders interpret as a meaningful shift in its near-term market structure. The decline comes as the broader crypto market remains in a corrective phase, leaving high-beta altcoins like Solana particularly exposed to momentum-driven drawdowns.
As of Tuesday 18:00 UTC, Solana was trading at $74.29, down 7.36% over the previous 24 hours. Losses have compounded over multiple time frames, with SOL down 11.10% over the past week and 13.28% over the last 30 days, reflecting a sustained period of weakening demand.
Despite holding its position as the seventh-largest cryptocurrency by market capitalization at roughly $42.98 billion, Solana’s trading activity suggests heightened distribution. Daily volume surged to about $4.82 billion, up 27.52% from the prior day—an acceleration that market participants often associate with 'capitulation risk' when it accompanies falling prices.
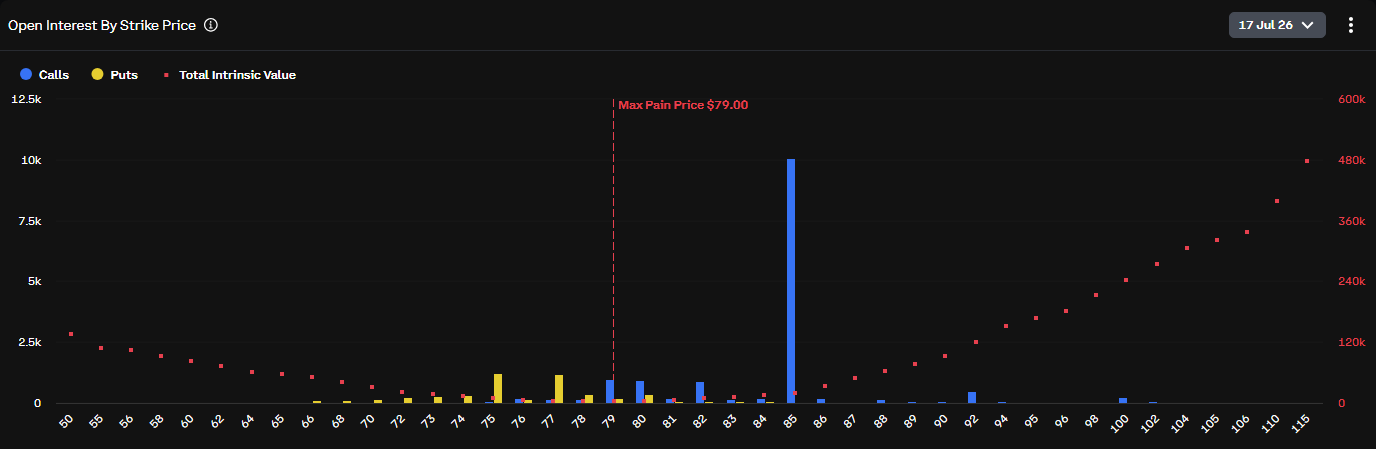
Technicians point to the $75–$80 zone as the key inflection area. After acting as a multi-week support band, that range is now widely viewed as 'overhead resistance'. Analysts following price-action models say the breakdown resembles a 'flag-and-pole' failure—typically interpreted as a continuation signal once the consolidation range gives way. Using a 'measured move' framework, some chart watchers place the next major downside objective in the low-$50s.
In that scenario, the $53–$54 area is emerging as the first critical test for dip-buying interest, with $45–$50 framed by traders as a larger, historically active demand zone that could serve as a last line of defense if the selloff extends.
Any near-term rebound attempts may struggle unless SOL can reclaim the former support band. While Solana showed a modest hour-to-hour bounce of around 1.5% at the time of observation, analysts argue that rallies into the $75–$80 region could attract sellers rather than confirm a sustainable reversal, given the recent structural break.
Token supply dynamics appear relatively stable in the short run. Circulating supply stands near 578.44 million SOL—about 92.16% of the reported total supply of 627.65 million. Solana’s fully diluted valuation (FDV) is estimated at roughly $46.63 billion, only about 8.51% above its current market cap, suggesting limited incremental dilution pressure compared with tokens that have large portions of supply still locked or scheduled for release.
Market microstructure data also indicates that the bulk of trading remains concentrated on centralized exchanges. Reported volumes showed approximately $4.82 billion on centralized venues versus roughly $35,000 on decentralized exchanges, reinforcing the view that flows are being driven primarily by large, execution-focused participants rather than on-chain DEX activity. In practice, such skew can coincide with 'position unwinds' by high-volume traders during risk-off periods.
Adding to the cautious tone, traders have noted an absence of major ecosystem catalysts in the immediate news cycle. No widely cited protocol upgrade timeline changes, governance-driven development shifts, or major new dApp launches have been highlighted over the past day in mainstream coverage. In periods where fundamentals are quiet, attention tends to narrow to liquidity conditions, technical levels, and short-term sentiment—factors that can amplify volatility when key supports break.
With SOL down 7.34% over 60 days and 17.91% over 90 days, the broader trend remains pointed lower, while its market dominance near 1.87% underscores relative softness versus some competing large-cap assets during the current market phase.
For now, the market’s focus is on whether Solana can stabilize above the low-$50s if downside momentum persists, and whether any recovery attempt can decisively retake the $75–$80 band. The next several sessions may be pivotal in determining whether the latest breakdown becomes a prolonged downtrend leg or a shakeout that draws in new demand at lower support zones.


Comment 0