 News
News  Coin Information
  About us
  Customer Service


Solana (SOL) slid to the low-$60s on Friday as ‘institutional selling’ and deteriorating technical signals intensified pressure on one of the market’s largest layer-1 tokens, raising concerns that a key support zone is at risk of giving way.
As of 10:05 p.m. Friday in Seoul (9:05 a.m. ET / 1:05 p.m. UTC), SOL traded at $62.90, down 4.7% over the past 24 hours. The selloff has been sharper over longer horizons: SOL is down 23.63% over the past week and 29.80% over the past month, reflecting a broader breakdown of previously defended technical levels.
Solana currently ranks among the largest cryptoassets by market capitalization, with an estimated market cap of roughly $36.4 billion. Despite the price drop, 24-hour trading volume rose 1.55% to about $5.03 billion, a combination that typically signals elevated ‘distribution’ rather than a vacuum of liquidity—suggesting that sellers remain active even as bids attempt to stabilize the decline.
Institutional transfers add to supply overhang
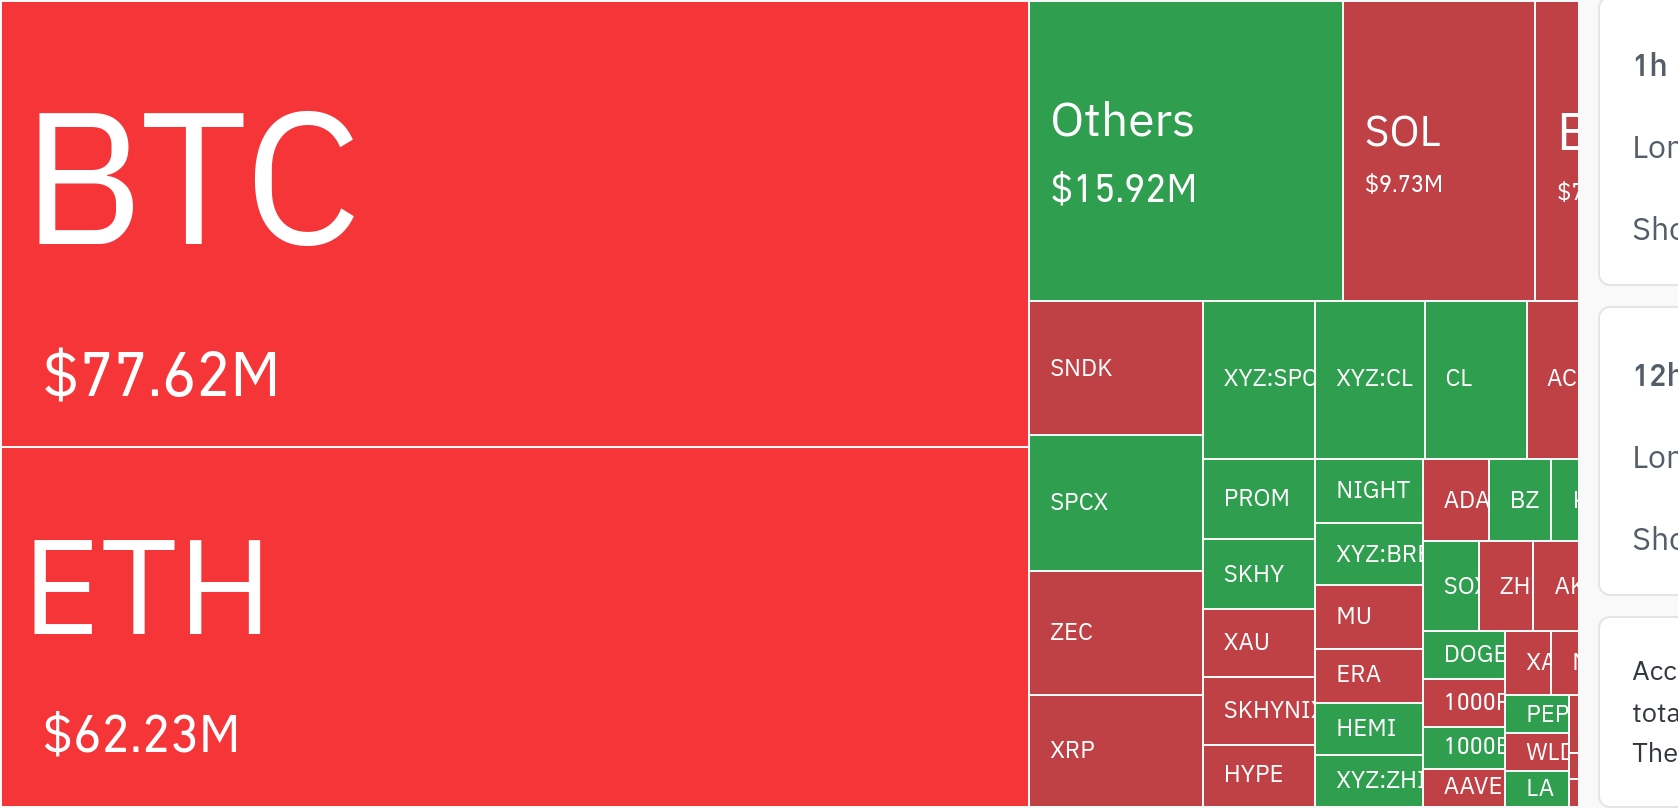
The immediate catalyst highlighted by market observers has been a large transfer tied to institutional positioning. According to a CryptoRank report, Forward Industries moved 455,784 SOL to Coinbase Prime—an action widely interpreted as preparation for selling or position reduction.
CryptoRank also flagged that the entity is sitting on substantial ‘unrealized losses’, estimated at roughly $1.13 billion on its Solana holdings. While unrealized losses do not guarantee imminent liquidation, analysts often view large exchange-directed transfers as a potential source of near-term supply, especially when combined with a fragile market structure.
Market participants noted that if additional size is routed to trading venues, short-term volatility could rise further. “Large inflows to exchanges tend to compress the timeline for price discovery,” one market commentator said, pointing to the risk that stop-loss activity and forced deleveraging could amplify moves around key levels.
Technical picture turns decisively bearish
From a charting perspective, Solana has fallen below its 50-day, 100-day, and 200-day moving averages, according to CryptoRank’s technical snapshot. The breakdown also marks a departure from the prior $80–$90 consolidation range, shifting sentiment toward a more clearly defined downtrend.
Several market reports have identified the $63–$65 area as the most immediate ‘support’ zone. A sustained move below that band could expose SOL to a deeper pullback into the mid-$50s, traders said, as liquidity thins and prior demand pockets become resistance.
Coinpaper, referencing on-chain positioning, described the $70–$50 region as a broad accumulation corridor, while pointing to $53, $35, and $24 as notable support candidates if selling continues. Those levels, derived from historical activity and wallet cost-basis clustering, are often watched for signs of capitulation or renewed spot demand.
Firedancer expectations support longer-term narrative
Despite the near-term weakness, some analysts argue the longer-term thesis for Solana remains intact, particularly if network upgrades improve reliability and throughput. Exchange BuyUcoin highlighted the development of ‘Firedancer’—a new validator client aimed at enhancing performance and resilience—as a key milestone being tracked in June updates.
Firedancer, led by Jump Crypto in collaboration with the Solana ecosystem, is designed to expand validator diversity and improve network robustness—issues that have been central to Solana’s multi-year push to compete at scale with other high-throughput chains. BuyUcoin described Solana as one of the more closely watched large-cap crypto projects, while noting that recent momentum has been dampened by broader market stress and profit-taking.
Solana’s token economics remain a subject of ongoing discussion. The network operates with an inflationary issuance model rather than a hard-capped supply. Circulating supply stands near 578.67 million SOL, with total supply around 627.91 million SOL, based on figures cited in the report. SOL is listed across major exchanges and maintains deep market access, with broad pairing availability contributing to liquidity even during drawdowns.
For now, traders and analysts are focused on whether SOL can hold the $63–$65 band amid elevated exchange flows and weakening trend indicators. A successful defense could stabilize price action and slow the selloff, while a break lower would likely shift attention to the next cluster of demand levels highlighted by on-chain and technical studies.
🔎 Market Interpretation
- Price action: Solana (SOL) fell into the low-$60s, trading near $62.90 (-4.7%/24h), with deeper drawdowns of -23.63% (7d) and -29.80% (30d), signaling a sustained risk-off phase.
- Volume vs. price (distribution signal): Despite the decline, 24h volume rose to ~$5.03B (+1.55%). Rising volume alongside falling price typically suggests distribution (active selling into bids) rather than illiquidity-driven slippage.
- Institutional supply overhang: A reported transfer of 455,784 SOL to Coinbase Prime is being read as potential sell-side preparation, increasing perceived immediate supply risk.
- Fragile market structure: SOL breaking below key moving averages and exiting the prior $80–$90 range reinforces a bearish trend regime where rallies may be sold and support tests can accelerate.
- Key near-term pivot: The $63–$65 band is framed as the immediate support zone. A clean loss of this area raises odds of a slide toward the mid-$50s, where liquidity and prior demand are expected to be thinner.
💡 Strategic Points
- Watch exchange-flow follow-through: Additional large transfers to trading venues can shorten the time to price discovery and increase odds of fast moves driven by stop-loss triggers and deleveraging.
- Trend confirmation checklist: SOL is below its 50/100/200-day moving averages. Traders often treat this as a “sell-the-rally” backdrop unless price reclaims these averages and holds.
- Scenario map (levels to monitor):
- Hold scenario: Defending $63–$65 could slow selling pressure and enable a consolidation base.
- Breakdown scenario: Below $63, attention shifts to mid-$50s, with broader on-chain/technical references highlighting $53, then $35 and $24 as deeper historical support candidates if capitulation emerges.
- Range context: Prior $80–$90 consolidation may act as overhead resistance if price attempts a recovery.
- Risk framing around unrealized losses: The cited ~$1.13B unrealized loss does not guarantee selling, but it can increase sensitivity to downside catalysts (risk committees tightening exposure, hedging, or forced reductions).
- Longer-term narrative catalyst: Development of Firedancer (a new validator client led by Jump Crypto) is positioned as a potential medium/long-term positive—improving validator diversity, performance, and resilience—though it does not necessarily offset near-term technical weakness.
- Token supply considerations: Solana’s inflationary issuance (no hard cap) remains a valuation discussion point; cited figures place circulating supply ~578.67M SOL and total supply ~627.91M SOL, implying ongoing supply dynamics matter during selloffs.
📘 Glossary
- Institutional selling: Large-scale selling or position reduction by funds, companies, or large holders, often visible via exchange-directed transfers.
- Distribution: A market phase where selling pressure dominates despite active trading volume, often characterized by price declines on elevated turnover.
- Support zone: A price area where buying demand has historically been strong enough to pause or reverse declines (here, $63–$65).
- Moving Averages (50/100/200D): Trend indicators calculated from prior closing prices; trading below major MAs is commonly interpreted as bearish.
- Consolidation range: A sideways trading band (here $80–$90) that can later become resistance after a breakdown.
- Supply overhang: Expected near-term selling supply that can cap rallies (e.g., large holdings moved onto exchanges).
- Unrealized losses: Paper losses on holdings not yet sold; they can influence behavior but are not realized until a sale occurs.
- Deleveraging: Forced or voluntary reduction of leveraged positions; can amplify volatility when prices fall quickly.
- Validator client: Software that runs a network validator. Multiple clients can improve network resilience by reducing single-software dependency.
- Firedancer: A forthcoming Solana validator client intended to improve throughput and robustness, developed by Jump Crypto with ecosystem partners.
- Inflationary issuance: A token model where new tokens are continually issued over time rather than having a fixed maximum supply.


Comment 0