 News
News  Coin Information
  About us
  Customer Service


Solana (SOL) slipped back toward the mid-$60s this week, breaking below multiple widely watched support levels even as parts of its ecosystem continue to attract attention through new infrastructure launches. The price action underscores a market still dominated by risk-off sentiment and forced deleveraging, while longer-term narratives around network performance and developer momentum remain intact.
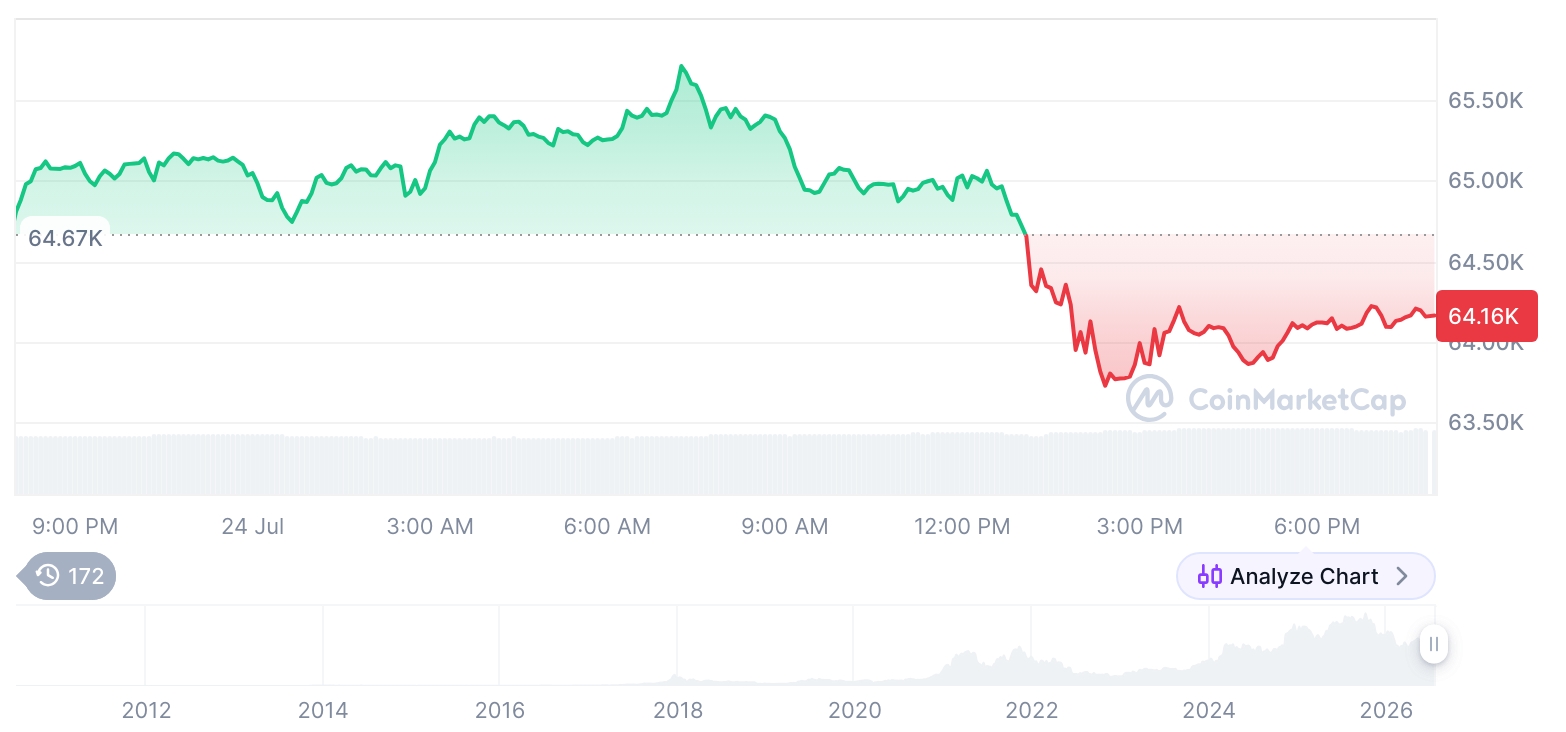
As of Tuesday 2:05 a.m. ET, Solana was trading at $64.25, down 4.08% over the past 24 hours. The token has fallen 13.52% over the last seven days and is down 32.41% on a monthly basis. Solana’s market capitalization stood at roughly $37.2 billion, with 24-hour trading volume around $2.5 billion.
In recent sessions, SOL briefly showed relative strength against Bitcoin (BTC), including a sharp intraday move that lifted the token about 6.5% to $66.66 while the SOL/BTC ratio rose roughly 4%—its strongest single-day gain in more than a month. That outperformance, however, proved short-lived. Broader selling pressure quickly reasserted itself as market-wide volatility rose and the crypto ‘Fear & Greed’ gauge dipped into ‘extreme fear’ territory.
The pullback in SOL has unfolded alongside a larger unwind across digital assets, with industry updates pointing to steep declines across major tokens, large-scale liquidations, and a sharp contraction in total market capitalization. In that context, Solana’s drawdown has mirrored the wider market’s loss of risk appetite rather than reflecting a Solana-specific shock.
Technically, analysts say the chart has deteriorated after SOL fell through the $80 and $70 zones that previously served as key support levels. Capital.com noted in a June 8 market briefing that Solana is now trading well below its major moving averages, widening the gap between spot price and trend indicators. The 20-day moving average is near $78, the 50-day around $84, the 100-day around $85, and the 200-day close to $102—levels that traders often cite as benchmarks for assessing whether a downtrend is losing steam.
On a performance basis, SOL is down roughly 47.8% year-to-date and remains about 77% to 78% below its January 2025 peak near $295. Some market observers argue that even tailwinds from ‘institutional demand’ have not been sufficient to absorb the scale of selling. Spot Solana ETF products have reportedly attracted about $1.45 billion in cumulative inflows since launch, but analysts say those allocations have not offset the broader liquidation-driven pressure and discretionary risk reduction across crypto.
Forward-looking price forecasts for 2026 remain wide, reflecting the gap between near-term technical damage and longer-term optimism about Solana’s role in high-throughput applications. CoinCodex projects a trading channel of roughly $65.35 to $115.56 with an estimated year-end level near $99.24. Changelly places SOL in an $84.30 to $100.21 range with an average around $92.26. Coinpedia outlines a broader $75 to $200 range, highlighting $97 as a key threshold that would need to be reclaimed before a move toward $116 becomes plausible from a resistance standpoint. Traders Union offers a more aggressive long-term path, penciling in $240 by mid-2026 and $260 by year-end, while categorizing four-digit prices as a more distant scenario.
Notably, Solana’s network fundamentals continue to draw positive commentary even as the token struggles. Materials distributed via GlobeNewswire and Business Insider described Solana’s performance in 2026’s first quarter as leading among major blockchains on measures such as speed and transaction throughput. That narrative—Solana as a high-performance Layer 1 suitable for sophisticated decentralized applications—has increasingly been paired with a broader shift toward infrastructure-led development across the ecosystem.
One project drawing attention is ‘Solana Unchained,’ an infrastructure-focused initiative that blends high-performance AI tooling with decentralized security in pursuit of what it calls everyday digital utility use cases. The project has entered the second phase of its token distribution, setting a presale price of $0.07 per UCHN token, with the next phase expected to lift the price to $0.09 in about three days. The team has indicated a planned public exchange listing price of $0.50. Total supply is capped at 100 million UCHN, with a portion earmarked for a USDC liquidity pool and locked on-chain for 12 months—tokenomics positioned as ‘non-inflationary’ with an emphasis on early liquidity formation. Project messaging has also stressed verifiable audits, transparent token structure, and an enterprise integration roadmap as part of its bid to become a core “infrastructure layer” within Solana’s next growth cycle.
Still, market participants say sentiment around Solana remains shaped not just by growth narratives but also by its history of reliability concerns. Traders Union pointed to past core upgrades—including runtime improvements and expanded developer tooling support—as constructive for usage and price in earlier cycles. However, the network outage in April 2024 continues to linger in investor memory; at the time, roughly 75% of transactions reportedly failed, damaging confidence and amplifying volatility. Even as the technology stack evolves, analysts say that episode remains a reference point in debates over resilience and operational risk.
For now, traders are watching whether SOL can stabilize in the $64 to $70 region, while broader trend reversal signals may depend on reclaiming key resistance bands around $84, $97, and $116 and closing the distance to major moving averages. The next phase for Solana’s market structure, analysts say, will likely be driven by the interplay between ETF flow persistence, macro conditions, and whether ecosystem growth can translate into renewed ‘liquidity inflow’ amid a still-fragile risk environment.
🔎 Market Interpretation
- Price trend: SOL slid back to the mid-$60s and broke below previously watched supports ($80 and $70), reflecting continued downside momentum.
- Current snapshot: Around $64.25 (as of Tuesday 2:05 a.m. ET), down ~4.1% daily, ~13.5% weekly, and ~32.4% monthly; market cap ~$37.2B and 24h volume ~$2.5B.
- Macro-driven selloff: The drawdown is framed as part of a broader crypto risk-off move (forced deleveraging, liquidations, falling total market cap) rather than a Solana-specific shock.
- Brief relative strength vs BTC: SOL outperformed BTC intraday (SOL up ~6.5% to $66.66; SOL/BTC +~4%), but the move faded as overall volatility rose and the Fear & Greed index hit “extreme fear.”
- Technicals weakened: SOL is trading well below major moving averages (20D ~78, 50D ~84, 100D ~85, 200D ~102), signaling a persistent downtrend and a widened gap to trend benchmarks.
- Longer-term damage: SOL is down ~47.8% YTD and ~77–78% below its January 2025 peak near $295, highlighting how far sentiment has shifted from prior cycle highs.
- ETF inflows not enough (yet): Reported cumulative spot Solana ETF inflows (~$1.45B) have not offset liquidation pressure and broad discretionary risk reduction.
💡 Strategic Points
- Key near-term zone to watch: Market participants are monitoring whether SOL can stabilize in the $64–$70 range after losing higher supports.
- Resistance map for trend repair: Analysts highlight reclaiming $84 (near the 50D MA), then $97 (major threshold cited by forecasters), and $116 as notable levels for a clearer reversal case.
- Moving averages as “regain” milestones: Closing the gap toward the 20D/50D/100D/200D averages is positioned as an important confirmation step that selling pressure is easing.
- Forecast dispersion implies high uncertainty: 2026 projections span from conservative channels (~$65–$116) to wider bullish cases (up to ~$200), with some aggressive paths calling for ~$240–$260 by end-2026—underscoring that outlook depends heavily on macro liquidity and risk appetite.
- Fundamentals remain supportive: Despite weak price action, the article notes positive commentary on Solana’s throughput/speed and continued developer/infrastructure momentum—a potential tailwind if broader market conditions improve.
- Ecosystem catalyst (infrastructure narrative): “Solana Unchained” is highlighted as an infrastructure-focused project combining AI tooling and decentralized security; presale pricing steps ($0.07 to $0.09) and a stated target listing price ($0.50) are presented as part of ecosystem building rather than immediate SOL price support.
- Risk checklist: Reliability concerns remain a sentiment overhang (April 2024 outage cited with high transaction failure rates). Any recurrence could amplify volatility, while successful upgrades and stability could help rebuild confidence.
- What could drive the next regime: The article frames the next phase as a mix of ETF flow persistence, macro conditions, and whether ecosystem growth converts into fresh liquidity inflows.
📘 Glossary
- Support / Resistance: Price areas where buying (support) or selling (resistance) historically increases; breaks can accelerate trends.
- Moving Average (MA): A trend indicator averaging price over a set period (e.g., 20D, 50D, 200D). Price below key MAs often indicates bearish trend.
- Risk-off sentiment: A market environment where investors reduce exposure to volatile assets and move toward perceived safety.
- Deleveraging: Traders reducing borrowed exposure; often triggers rapid selling and liquidations when prices fall.
- Liquidation: Forced closure of leveraged positions by exchanges when margin requirements are breached, intensifying downside moves.
- Fear & Greed Index: A sentiment gauge for crypto markets; “extreme fear” often coincides with high volatility and defensive positioning.
- SOL/BTC ratio: The price of SOL measured in BTC; rising ratio indicates SOL outperforming BTC.
- Spot ETF inflows: Net new capital entering spot exchange-traded products holding the underlying asset; can support prices when sustained.
- Tokenomics: The supply, distribution, lockups, and incentives governing a token’s economic design.
- Liquidity pool (e.g., USDC pool): Funds supplied to enable trading on DEXs; helps reduce slippage and improve market depth.
- Non-inflationary supply: A token design where supply is capped or does not expand over time, aiming to avoid dilution.
- Layer 1 (L1): A base blockchain network (like Solana) that processes transactions and supports applications directly.


Comment 0