 News
News  Coin Information
  About us
  Customer Service


LTC/USD chart - Trading View
Exchange - Coinbase
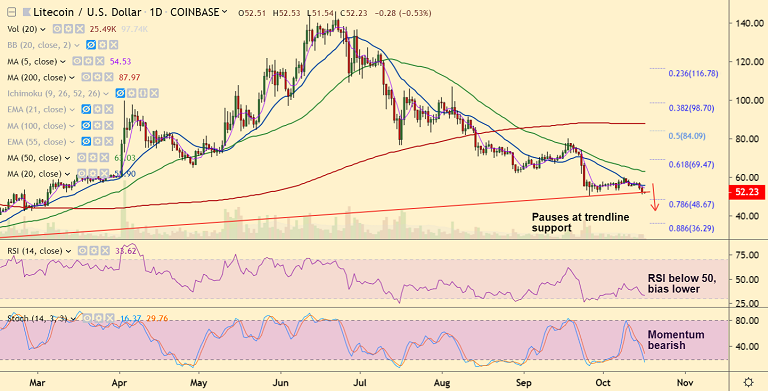
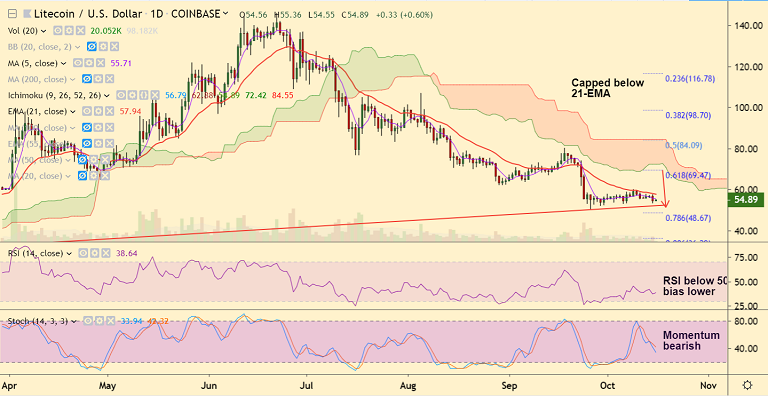
Support: 48.67 (78.6% Fib); Resistance: 57.22 (21-EMA)
Technical Analysis: Bias Bearish
LTC/USD has paused downside at strong trendline support (52).
Technical studies support further weakness, break below trendline support will see downside resumption.
Stochs and RSI are sharply lower, volatility is rising as shown by expanding Bollinger bands.
MACD is well in the negative territory and ADX is rising in support of downside.
Next major support aligns at 78.6% Fib at 48.67 ahead of 42.40 (Feb 27 low).
5-DMA is immediate resistance at 54.53. Break above 50-DMA required for further upside.


Comment 0