 News
News  Coin Information
  About us
  Customer Service


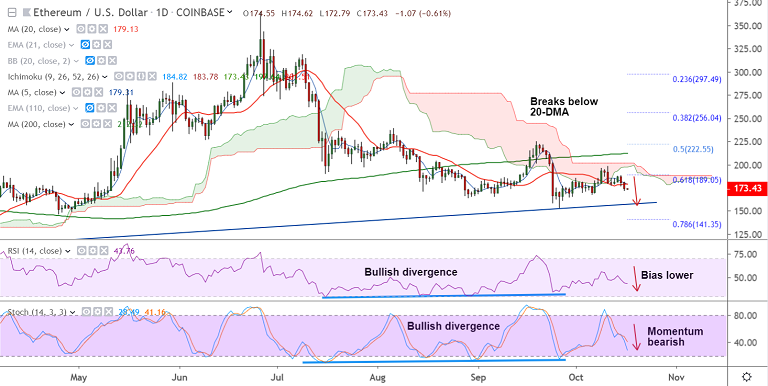
ETH/USD chart - Trading View
Exchange - Coinbase
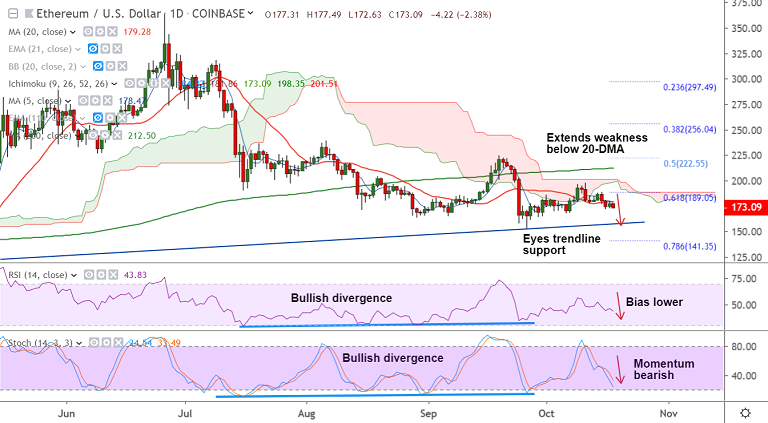
Support: 167.50 (Oct 6 low); Resistance: 179 (converged 5 and 20 DMAs)
Technical Analysis: Bias Bearish
ETH/USD struggles to extend recovery above 179 mark, bias remains bearish.
The pair is extending weakness on the day, following slump in Bitcoin prices.
ETH/USD was trading 2.22% lower on the day at 173.46 after closing 1.61% higher on Thursday's trade.
Price action is extending weakness below 20-DMA support and is now on track to test Oct 6th lows at 167.50.
Major and minor trend are bearish as indicated by GMMA indicator. Break below 167.50 will see test of trendline support at 158 level.
Volatility is low. Bullish divergence could limit downside.
Also Stochastics oscillator on weekly charts has approached oversold zone.
Retrace above strong resistance at 179 (nearly converged 5 and 20 DMAs) to see more gains. Bearish invalidation only above 200-DMA.


Comment 0