 News
News  Coin Information
  About us
  Customer Service


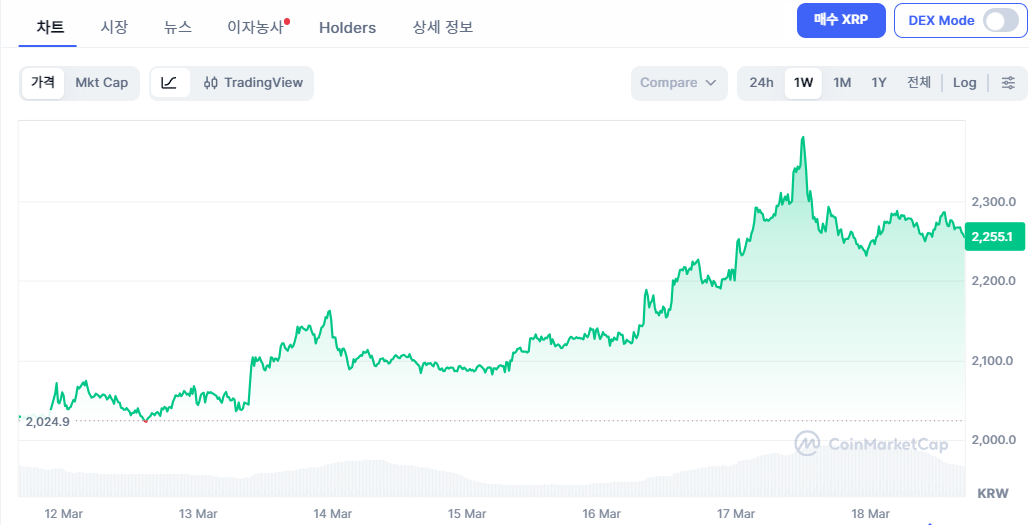
Ripple (XRP) is consolidating after a sharp short-term rally, with AI-driven outlooks split on whether the next move is a rebound continuation or a renewed leg lower—underscoring a market caught between fading momentum and an entrenched downtrend.
XRP recently climbed from roughly $1.34 to $1.54 before losing steam and drifting near $1.45, a range-bound phase that typically signals traders are waiting for the next catalyst. A synthesis of three AI models—xAI’s Grok, OpenAI’s GPT, and Anthropic’s Claude—frames the current setup as a transition period where a 'short-term bounce attempt' collides with a 'medium-to-long-term bearish structure'.
The models’ strongest point of agreement is that the broader trend remains weak. XRP is trading more than 30% below its 200-day simple moving average (SMA200) near $2.10, a widely watched benchmark that often defines whether an asset is in a sustained bull or bear phase. That gap suggests the recent surge looks more like a technical rebound than a confirmed trend reversal.
At the same time, the short-term picture has not decisively broken down. The relative strength index (RSI) sits around 52—squarely in a 'neutral zone'—implying neither overheated buying nor capitulation selling. With RSI holding above 50, the models interpret this as evidence that dip-buying interest remains present, even if conviction is limited.
Volume dynamics are where the caution grows louder. Trading activity surged during the run-up, indicating fresh demand helped drive prices higher. But volume has thinned markedly after the local peak, a pattern that often reflects the absence of chase buying and makes follow-through rallies harder to sustain. In that context, the market’s next push higher may require a clear 'liquidity inflow' rather than gradual grinding.
Key levels are relatively well defined. On the downside, the $1.40 area is acting as an important support zone, reinforced by recent concentrated trading around that price. On the upside, $1.50 to $1.54 has emerged as the immediate resistance band, aligning with the prior high and a psychological threshold that can attract sell orders.
Using that range as a reference point, the AI models outline near-term scenarios over the next 24 hours. A decisive break above $1.50 with volume confirmation could extend a rebound toward $1.55 to $1.58. Conversely, a clear breakdown below $1.40 could reopen $1.34, with the possibility of a deeper slide into the low $1.30s if selling pressure accelerates. Across the models, a recurring warning is that an upside move without volume may amount to a 'fake breakout' that quickly reverses.
Where the models differ is in probability weighting. xAI’s Grok, leaning on volume and momentum reversion signals, assigns a rebound chance in the low-60% range, while GPT similarly allows for a limited upside continuation under the right conditions. Claude is more skeptical, placing the rebound probability below 40% by emphasizing the post-peak volume drop and the persistent structural downtrend. The combined takeaway is that a bounce remains possible, but downside risk still holds the edge.
For now, XRP sits in a holding pattern: a 'bounce candidate' as long as $1.40 is defended, but still far from a backdrop that would justify calling a durable trend reversal. Whether support holds—and whether any move through $1.50 comes with credible volume—appears set to determine the next directional swing in the near term.
🔎 Market Interpretation
- XRP is consolidating after a quick rebound ($1.34 → $1.54) and is now hovering around ~$1.45, signaling indecision and a wait-and-see posture for the next catalyst.
- Broader structure remains bearish: price is >30% below the 200-day SMA (~$2.10), implying the recent move looks more like a technical rebound than a confirmed trend reversal.
- Momentum is neutral-short-term: RSI ~52 suggests neither overbought conditions nor panic selling; dip-buying interest exists but appears cautious.
- Volume is the key risk signal: strong volume accompanied the initial rally, but post-peak volume has thinned, often reducing the odds of sustained upside follow-through.
- Market is effectively range-bound between well-defined levels: support near $1.40 and resistance around $1.50–$1.54.
💡 Strategic Points
- Key support to watch: $1.40
- Holding above $1.40 keeps the "bounce candidate" thesis intact.
- A decisive breakdown below $1.40 increases odds of revisiting ~$1.34 and potentially sliding into the low $1.30s if selling accelerates.
- Key resistance to watch: $1.50–$1.54
- A clean break above $1.50, ideally with volume confirmation, could extend the rebound toward $1.55–$1.58.
- Upside attempts without volume are flagged as higher risk for a "fake breakout" that reverses quickly.
- Volume confirmation is the primary filter:
- Traders should treat any move beyond the range as lower quality if trading activity does not expand meaningfully (i.e., no notable liquidity inflow).
- Scenario framework (next ~24 hours per article):
- Bull case: reclaim $1.50 with stronger volume → target zone $1.55–$1.58.
- Bear case: lose $1.40 → retest $1.34; risk of deeper weakness into low $1.30s.
- AI model split (probability weighting):
- Grok: rebound odds in the low-60% range (leans on momentum/mean reversion).
- GPT: allows for limited continuation higher if conditions (especially volume) align.
- Claude: more bearish (<40% rebound odds), emphasizing volume fade and dominant downtrend.
- Combined takeaway: bounce is possible, but downside risk remains slightly favored unless volume returns.
📘 Glossary
- Consolidation: Sideways price movement after a strong move, often forming a range as traders await new information.
- Rebound / Technical bounce: A short-term recovery within a larger downtrend, not necessarily a true trend reversal.
- Downtrend (structural bearishness): A market regime characterized by lower highs/lower lows over a broader timeframe.
- SMA200 (200-day Simple Moving Average): A long-term trend benchmark; trading well below it often signals a bearish market phase.
- RSI (Relative Strength Index): Momentum oscillator (0–100) used to gauge overbought/oversold conditions; ~50 is neutral.
- Support: A price area where buying interest historically increases, potentially preventing further declines.
- Resistance: A price area where selling interest often appears, potentially capping rallies.
- Volume: The amount traded; rising volume can validate breakouts, while falling volume can signal weakening conviction.
- Liquidity inflow: Increased participation/capital entering the market, often visible through higher volume and tighter execution.
- Fake breakout: A brief move beyond support/resistance that quickly reverses, often occurring when volume/participation is weak.


Comment 0