 News
News  Coin Information
  About us
  Customer Service


Crypto traders on Telegram are increasingly debating whether the market has entered a short-lived ‘bounce zone’ amid ‘Extreme Fear,’ with technical setups around the lower end of Bollinger Bands and oversold momentum indicators dominating community chatter. The discussion suggests that while Bitcoin (BTC) has stabilized near the $70,000 area, many major altcoins remain heavy—raising the odds of sharp, event-driven volatility in the near term.
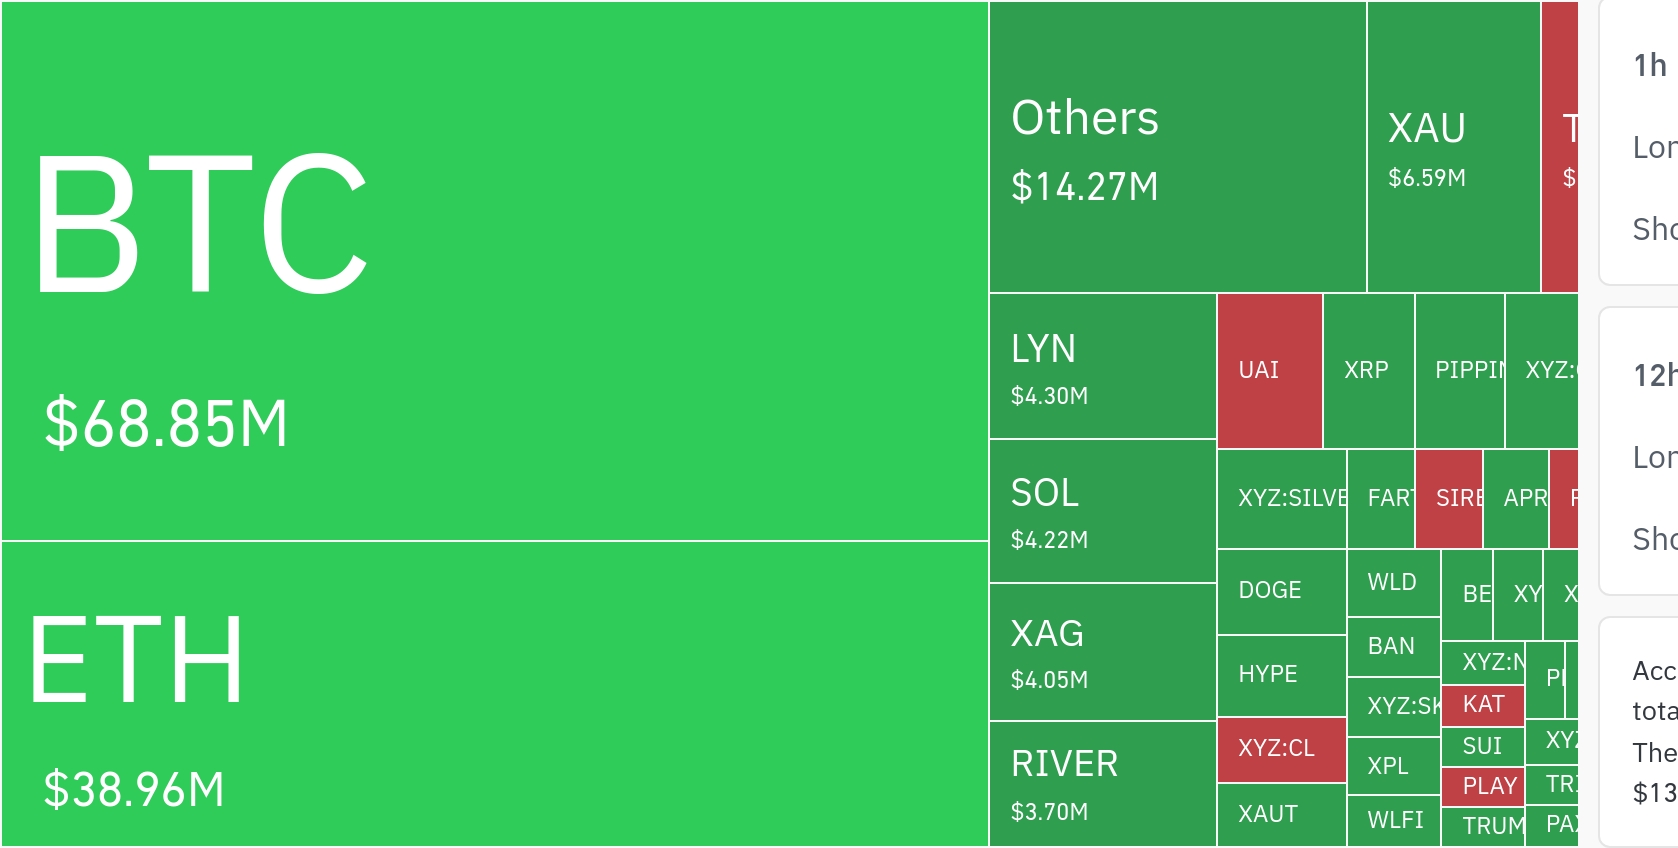
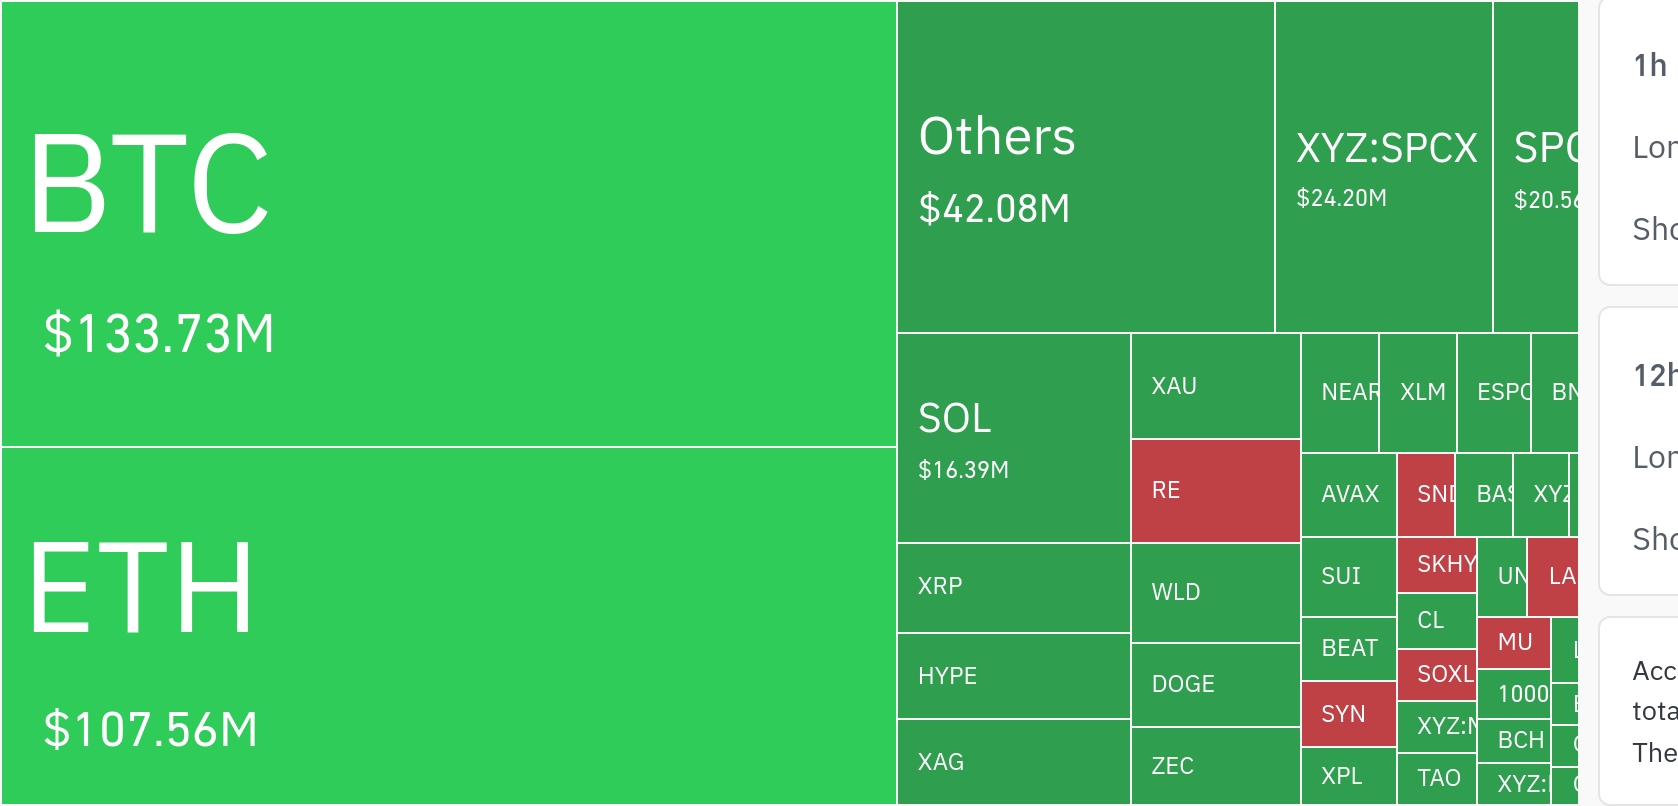
The shift in tone was captured by the widely circulated Fear & Greed Index reading of 11, a level typically associated with capitulation-style sentiment. Alongside that, community dashboards highlighted total crypto market capitalization around $2.49 trillion and Bitcoin dominance near 56.5%, reinforcing a narrative that BTC is holding up better than the broader altcoin complex.
According to a community trend review compiled using TokenPost and DataMaxiPlus monitoring of Telegram engagement, traders were repeatedly sharing similar playbooks: price ‘hugging’ the lower Bollinger Band, RSI in or approaching oversold territory, and weakening MACD signals—often framed as conditions that can produce a reflex rally even within a broader downtrend.
Uniswap (UNI) was one of the most discussed examples. Posts circulating in the Bitcoin Bullets® channel described UNI/USDT as maintaining a bearish structure, with RSI entering oversold territory and MACD confirming downside momentum. Traders focused on a tight cluster of levels: holding above 3.627 was framed as a prerequisite for a push toward 3.932 as a potential ‘relief rally,’ while a break below 3.577 was seen opening the door to a retest near 3.45.
Ethereum (ETH) attracted similar attention for its weak momentum profile. Community charts flagged RSI near 33 and a softening MACD, with 2,092 highlighted as the key pivot zone. From there, the most shared scenarios mapped either a recovery attempt toward 2,188 resistance, or further downside toward 2,022 if 2,066 gives way—reflecting the view that ETH is still struggling to reclaim leadership even as BTC steadies.
Across a wide set of altcoins, Telegram channels circulated scenario-style summaries emphasizing “weak rebound vs. additional decline” setups. Optimism (OP) was tracked around 0.1168 as a make-or-break support, while Dash (DASH) discussions centered on whether 32.15 could hold. Mantle (MNT) was framed between 0.732 on the upside and 0.710 on the downside as the immediate decision range.
Zcash (ZEC) posts focused on 231.37 as the reference level, with traders weighing an attempt toward 237.52 versus a drop toward 220.39 and potentially 206.05 if support fails. Dogwifhat (WIF) was also highlighted, with 0.1693 described as a pivot that—if reclaimed—could allow a test of the 0.1800–0.1905 zone, while a breakdown below 0.1647 was treated as a renewed risk trigger. A recurring refrain across these discussions was to “trade the levels,” reflecting a tactical mindset rather than conviction positioning.
Beyond charting, community participants shared interpretations of onchain and derivatives activity, including the idea that flows may be shifting from spot venues toward derivatives exchanges. Some posts framed a higher migration rate from Coinbase spot activity into derivatives markets as a ‘risk-on’ signal—though others treated it as a leverage warning, given that elevated derivatives participation can amplify liquidations when price swings intensify.
Event and campaign-related updates also remained in circulation, including exchange promotions and conference-related speculation tied to Korea Blockchain Week (KBW). At the same time, traders increasingly pointed to ‘exogenous risk’ as a reason to temper confidence in purely technical setups.
Geopolitics featured prominently in that risk framing, with posts referencing Iran-related headlines—such as discussions around potential Hormuz Strait passage fees and reports of strikes on refining infrastructure—along with regional security-related items. The combined effect was a market narrative in which oversold technical conditions are being weighed against macro and geopolitical uncertainty that can rapidly shift liquidity and sentiment.
Overall, the day’s most engaged content reflected a market leaning heavily on shared technical signals—lower Bollinger Band pressure, oversold RSI, and weakening MACD—to outline short-term trading scenarios under ‘Extreme Fear.’ But the parallel surge in derivatives positioning talk, promotional/event updates, and geopolitical headlines underscored a common conclusion across channels: near-term volatility risk remains elevated even if a tactical rebound materializes.
🔎 Market Interpretation
- Sentiment at capitulation levels: Telegram trading communities are treating the Fear & Greed Index reading of 11 as “Extreme Fear,” often associated with forced selling and potential short-term exhaustion.
- BTC holding, alts lagging: Bitcoin stabilizing near $70,000 while major altcoins remain heavy supports a “BTC resilience vs. altcoin weakness” regime, echoed by $2.49T total market cap and 56.5% BTC dominance.
- “Bounce zone” framing: Repeated references to price pressing the lower Bollinger Band, oversold/near-oversold RSI, and weakening MACD indicate an expectation of a potential reflex rally—but one that may occur within a broader downtrend.
- Volatility still the base case: Despite the tactical rebound narrative, traders are simultaneously emphasizing event-driven risk (promotions, conferences, geopolitics) and derivatives leverage as volatility accelerants.
- Macro/geopolitical overhang: Iran-related headlines (e.g., Hormuz Strait passage fee discussions, refinery strike reports) are repeatedly cited as “exogenous risk,” potentially overpowering purely technical setups.
💡 Strategic Points
- Tactical, level-based playbooks dominate: The community’s repeated mantra—“trade the levels”—suggests shorter holding periods, tighter invalidation points, and reduced conviction sizing in “Extreme Fear” conditions.
- UNI focus (scenario mapping):
- Relief attempt condition: Holding above 3.627 is widely framed as the prerequisite for a push toward 3.932.
- Downside trigger: A break below 3.577 is treated as opening risk toward ~3.45.
- Signal context: “Bearish structure” with RSI oversold + MACD downside confirmation implies bounces may be sold unless momentum improves.
- ETH focus (leadership test):
- Pivot zone: 2,092 highlighted as the key reference area for bias.
- Upside path: Recovery scenarios cluster around 2,188 resistance.
- Bear continuation: If 2,066 fails, communities cite risk toward 2,022.
- Interpretation: Weak momentum (RSI ~33, softening MACD) reinforces the view ETH is not reclaiming leadership even as BTC steadies.
- Altcoin “decision ranges” (risk-defined setups):
- OP: 0.1168 described as make-or-break support.
- DASH: Community attention on whether 32.15 holds.
- MNT: Near-term range framed between 0.732 (upside) and 0.710 (downside).
- ZEC: Reference at 231.37; upside toward 237.52 vs. downside to 220.39 and possibly 206.05 if support fails.
- WIF: Reclaiming 0.1693 seen as enabling a test of 0.1800–0.1905; breakdown below 0.1647 treated as renewed risk trigger.
- Derivatives migration = double-edged: Some interpret shifting activity from spot (e.g., Coinbase) toward derivatives as risk-on; others warn it can signal fragile, leverage-driven price action that raises liquidation risk.
- Event/calendar sensitivity: KBW-related speculation and exchange campaigns are treated as potential catalysts, but also as noise that can cause abrupt liquidity shifts—reinforcing the “trade small, trade reactive” posture.
📘 Glossary
- Fear & Greed Index: A sentiment gauge; very low readings (e.g., 11) often reflect panic selling and risk aversion.
- Capitulation: A phase where sellers aggressively exit positions, sometimes marking temporary bottoms due to exhaustion.
- Bollinger Bands: Volatility bands around price; “hugging the lower band” suggests persistent weakness and potential oversold conditions.
- RSI (Relative Strength Index): Momentum oscillator; readings near/below ~30 commonly interpreted as oversold, though oversold can persist in downtrends.
- MACD: Trend/momentum indicator; weakening or negative signals can confirm downside momentum or loss of upside strength.
- Reflex rally / relief rally: A short-term bounce driven by oversold conditions, short covering, or temporary demand—often within a larger downtrend.
- Support / Resistance: Price areas where buying (support) or selling (resistance) is expected to increase; often used to define risk and trade invalidation.
- Pivot zone: A key price level/area that traders use to determine directional bias (above = stronger, below = weaker).
- Bitcoin dominance: BTC’s share of total crypto market cap; rising dominance can indicate capital concentrating in BTC vs. altcoins.
- Derivatives: Instruments like futures and perpetuals; increased participation can amplify moves via leverage and liquidations.
- Liquidation: Forced closing of leveraged positions when margin requirements are breached, often accelerating price swings.
- Exogenous risk: Non-market internal factors (e.g., geopolitics, regulatory shocks) that can abruptly change sentiment and liquidity.


Comment 0