 News
News  Coin Information
  About us
  Customer Service


Crypto derivatives traders were hit with a sharp wave of forced unwinds over the past day, with roughly $686.49 million in leveraged positions liquidated despite only modest spot-price moves—an outcome that underscores how crowded positioning can turn a quiet market into a volatility trap.
Data aggregated by CoinGlass showed long positions accounting for the bulk of the damage: about $475.82 million in long liquidations versus $210.68 million in shorts, meaning roughly 69.3% of the total was concentrated on bullish bets. The imbalance suggests that while price action remained largely range-bound, traders’ expectations were skewed toward upside continuation—leaving the market vulnerable to cascading margin calls when momentum failed to follow through.
In the most recent four-hour window, liquidations were concentrated on a handful of major venues. Binance led with $43.70 million—about 44.72% of the total across tracked exchanges—with longs making up $35.49 million, or 81.2%. Bybit followed with $13.68 million, where longs represented 84.19% of liquidations. Hyperliquid ($11.23 million), OKX ($9.44 million), and Bitget ($7.56 million) rounded out the next tier.
Notably, liquidation flow was more balanced on HTX, where longs represented 55.05%, and on Aster at 51.73%, indicating a closer-to-even distribution of long and short risk. BitMEX, by contrast, showed an extreme skew, with longs accounting for 99.91%—effectively an almost one-sided flush.
By asset, liquidations clustered around the two largest cryptocurrencies—Bitcoin (BTC) and Ethereum (ETH)—even though each posted only marginal gains over 24 hours. Bitcoin saw $106.48 million liquidated, split between $54.31 million in longs and $52.17 million in shorts, while BTC was up about 0.1% to $103,672. Ethereum recorded $46.16 million in liquidations ($31.87 million longs and $14.29 million shorts) as ETH rose roughly 0.1% to $5,293. The combination of muted price changes and outsized liquidations points to elevated leverage sitting on top of a narrow trading range.
Among major altcoins, XRP led liquidation totals with $122.77 million over 24 hours—$66.58 million in longs and $56.19 million in shorts—while the token gained about 0.7%. Dogecoin (DOGE) followed with $73.64 million liquidated, including $44.91 million in longs and $28.73 million in shorts. Sui (SUI) saw $24.90 million in liquidations, while TRUMP totaled $14.51 million and Bitcoin Cash (BCH) posted $9.06 million.
TRUMP stood out as a reminder that liquidation risk is not always proportional to headline price movement. The token slipped around 0.2% over the period, yet long liquidations reached $9.43 million—well above $5.08 million in shorts—implying that traders positioned for a rebound were forced out even as the decline remained relatively contained.
Shorter timeframes showed signs of abrupt deleveraging. Over a one-hour span, Bitcoin liquidations totaled $188.39 million ($118.20 million longs and $70.19 million shorts), while Ethereum saw $152.04 million liquidated. Given that total exchange liquidations over the prior four hours were about $97.74 million, the hourly figures indicate an intense, concentrated burst of position closures centered on BTC and ETH—consistent with a brief volatility spike or a rapid sweep through clustered stop and liquidation levels.
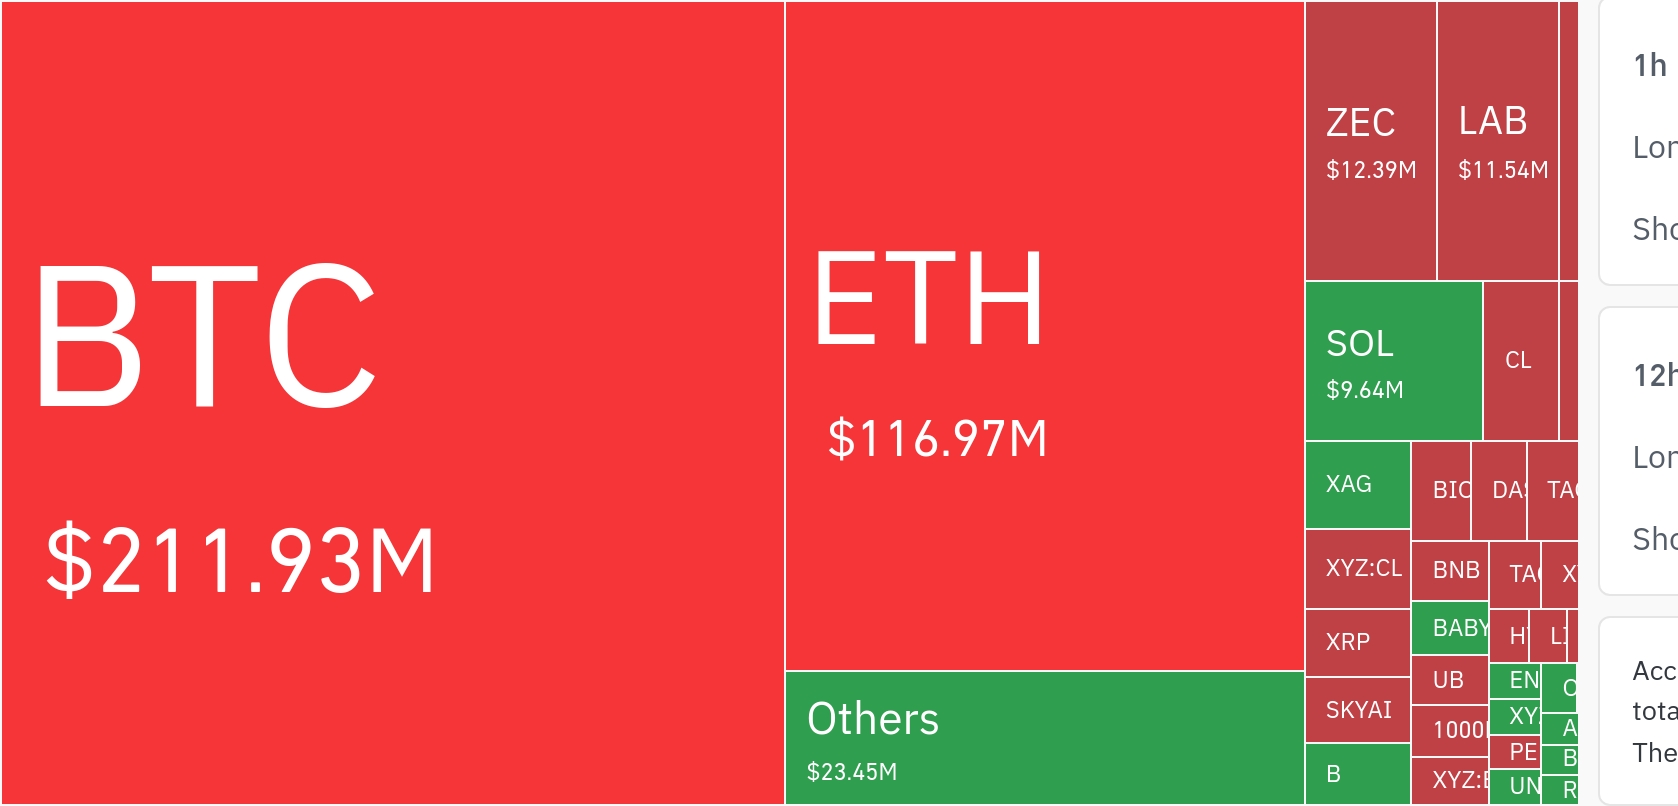
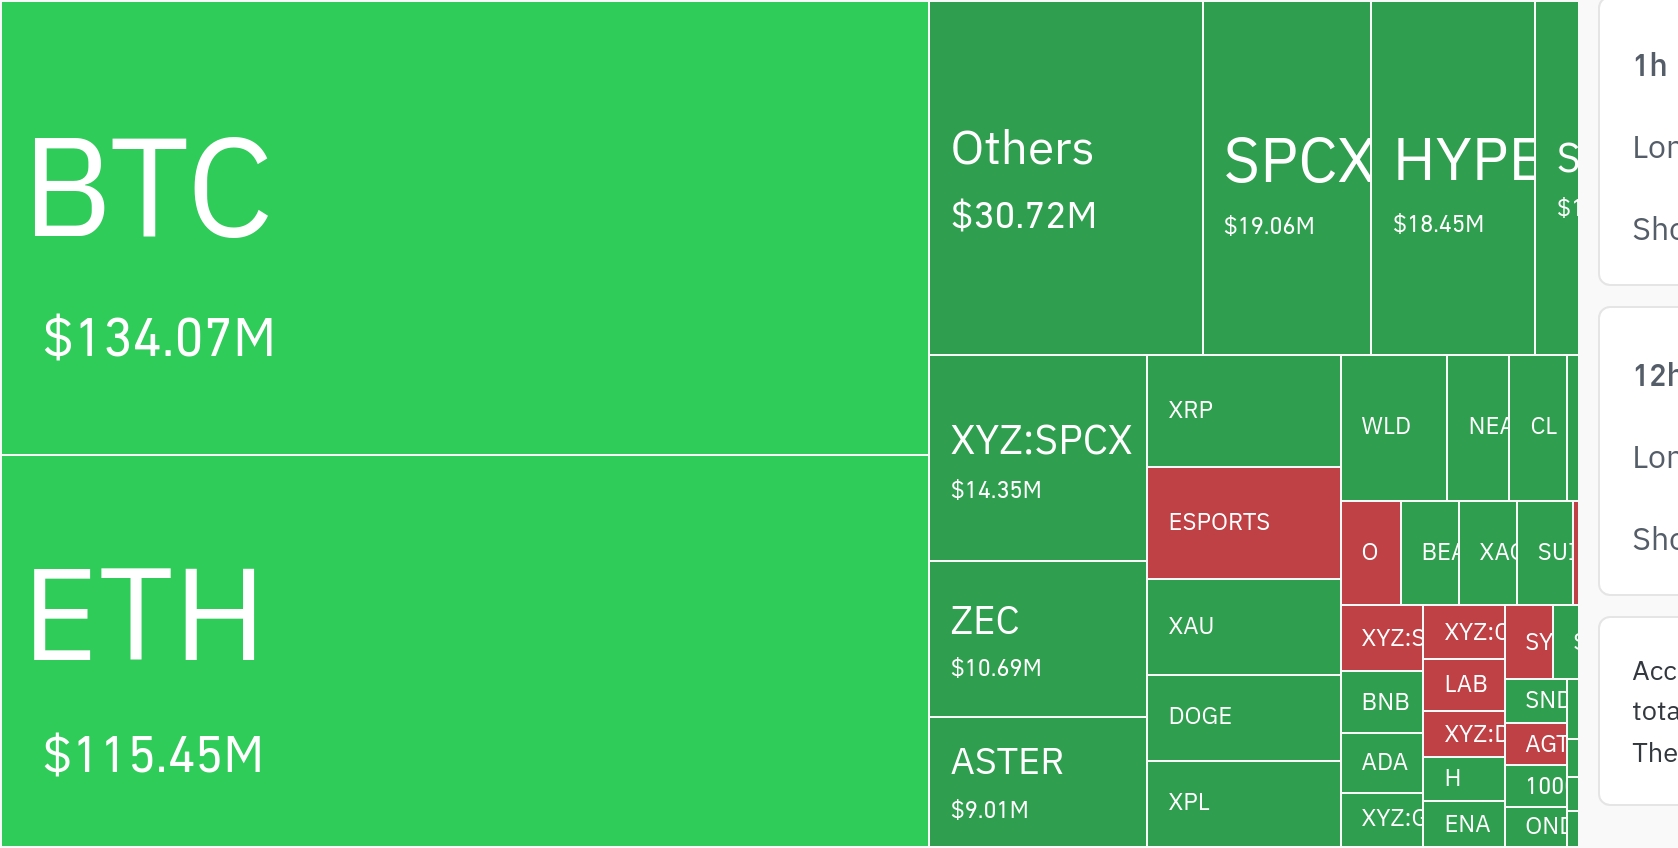
Heatmap-style 24-hour data further reinforced the concentration: Bitcoin accounted for about $211.93 million and Ethereum for $116.97 million in liquidations, with smaller but notable totals in Zcash (ZEC) at $12.39 million, LAB at $11.54 million, and Solana (SOL) at $9.64 million.
Overall, the episode highlights a recurring dynamic in crypto markets: heavy leverage can amplify market stress even when spot prices remain in a box. ‘Liquidation’ events—where exchanges forcibly close positions that fall below maintenance margin—tend to propagate when positioning becomes crowded, turning small moves into chains of forced selling or buying. The latest data suggests that leverage, rather than a decisive directional break, was the primary driver of the day’s volatility burden.
🔎 Market Interpretation
- Leverage-driven volatility: Roughly $686.49M in liquidations occurred despite only ~0.1% gains in BTC and ETH, signaling that positioning and leverage—not spot movement—were the main volatility engine.
- Long-side crowding: Long liquidations totaled $475.82M vs $210.68M shorts, meaning ~69.3% of liquidations hit bullish bets—consistent with an overly one-sided market expecting upside continuation.
- Range-bound “volatility trap”: Tight price action plus elevated leverage created conditions where small adverse moves triggered a cascade of forced unwinds, turning a quiet market into a liquidation event.
- Exchange concentration: In a recent 4-hour window, liquidations clustered on major venues—Binance led with $43.70M (~44.72% share), followed by Bybit ($13.68M) and Hyperliquid ($11.23M).
- Skew differences by venue: Some exchanges showed near one-sided long flushes (e.g., BitMEX longs ~99.91%), while others were closer to balanced (e.g., HTX longs ~55.05%, Aster ~51.73%).
- BTC/ETH as liquidation epicenter: Liquids clustered around majors even with muted returns—BTC $106.48M (nearly balanced long/short), ETH $46.16M (long-heavy).
- Altcoin stress notable: XRP led with $122.77M liquidations, followed by DOGE at $73.64M, indicating broad leverage build-up beyond BTC/ETH.
💡 Strategic Points
- Don’t equate “flat price” with low risk: Heavy leverage can make a narrow range fragile; monitor open interest, funding, and liquidation clusters to gauge hidden instability.
- Watch long/short liquidation imbalance: A long-dominant wipeout (here ~69% long) often implies crowded bullish positioning—increasing odds of stop/liq cascades on minor pullbacks.
- Liquidity events can be time-compressed: One-hour BTC liquidations reached $188.39M and ETH $152.04M, suggesting that deleveraging can occur in sharp bursts; consider smaller sizing or wider liquidation buffers during high leverage regimes.
- Venue-specific behavior matters: Higher long skew on certain exchanges may hint at where cascades start; cross-venue signals can improve timing around stop runs and spread widening.
- Altcoins can liquidate disproportionately: Examples like TRUMP (down ~0.2% but long liquidations $9.43M) show that leverage concentration can create outsized damage without headline moves—treat smaller caps as higher convexity risk.
- Risk controls to consider:
- Use lower effective leverage when markets are range-bound but OI stays elevated.
- Prefer hard stops and/or options hedges to reduce forced-liquidation risk.
- Avoid stacking positions near obvious support/resistance where liquidation heatmaps often cluster.
📘 Glossary
- Liquidation: An exchange’s forced closure of a leveraged position when margin falls below the maintenance requirement.
- Maintenance margin: The minimum collateral level required to keep a leveraged position open; falling below it triggers liquidation processes.
- Long / Short: Long profits from price increases; short profits from price decreases.
- Leveraged position: A trade using borrowed funds to amplify exposure; increases both potential returns and risk of liquidation.
- Cascading margin calls / liquidation cascade: A chain reaction where forced closures push price further, triggering additional liquidations.
- Range-bound market: Price trades within a relatively tight band without a sustained breakout.
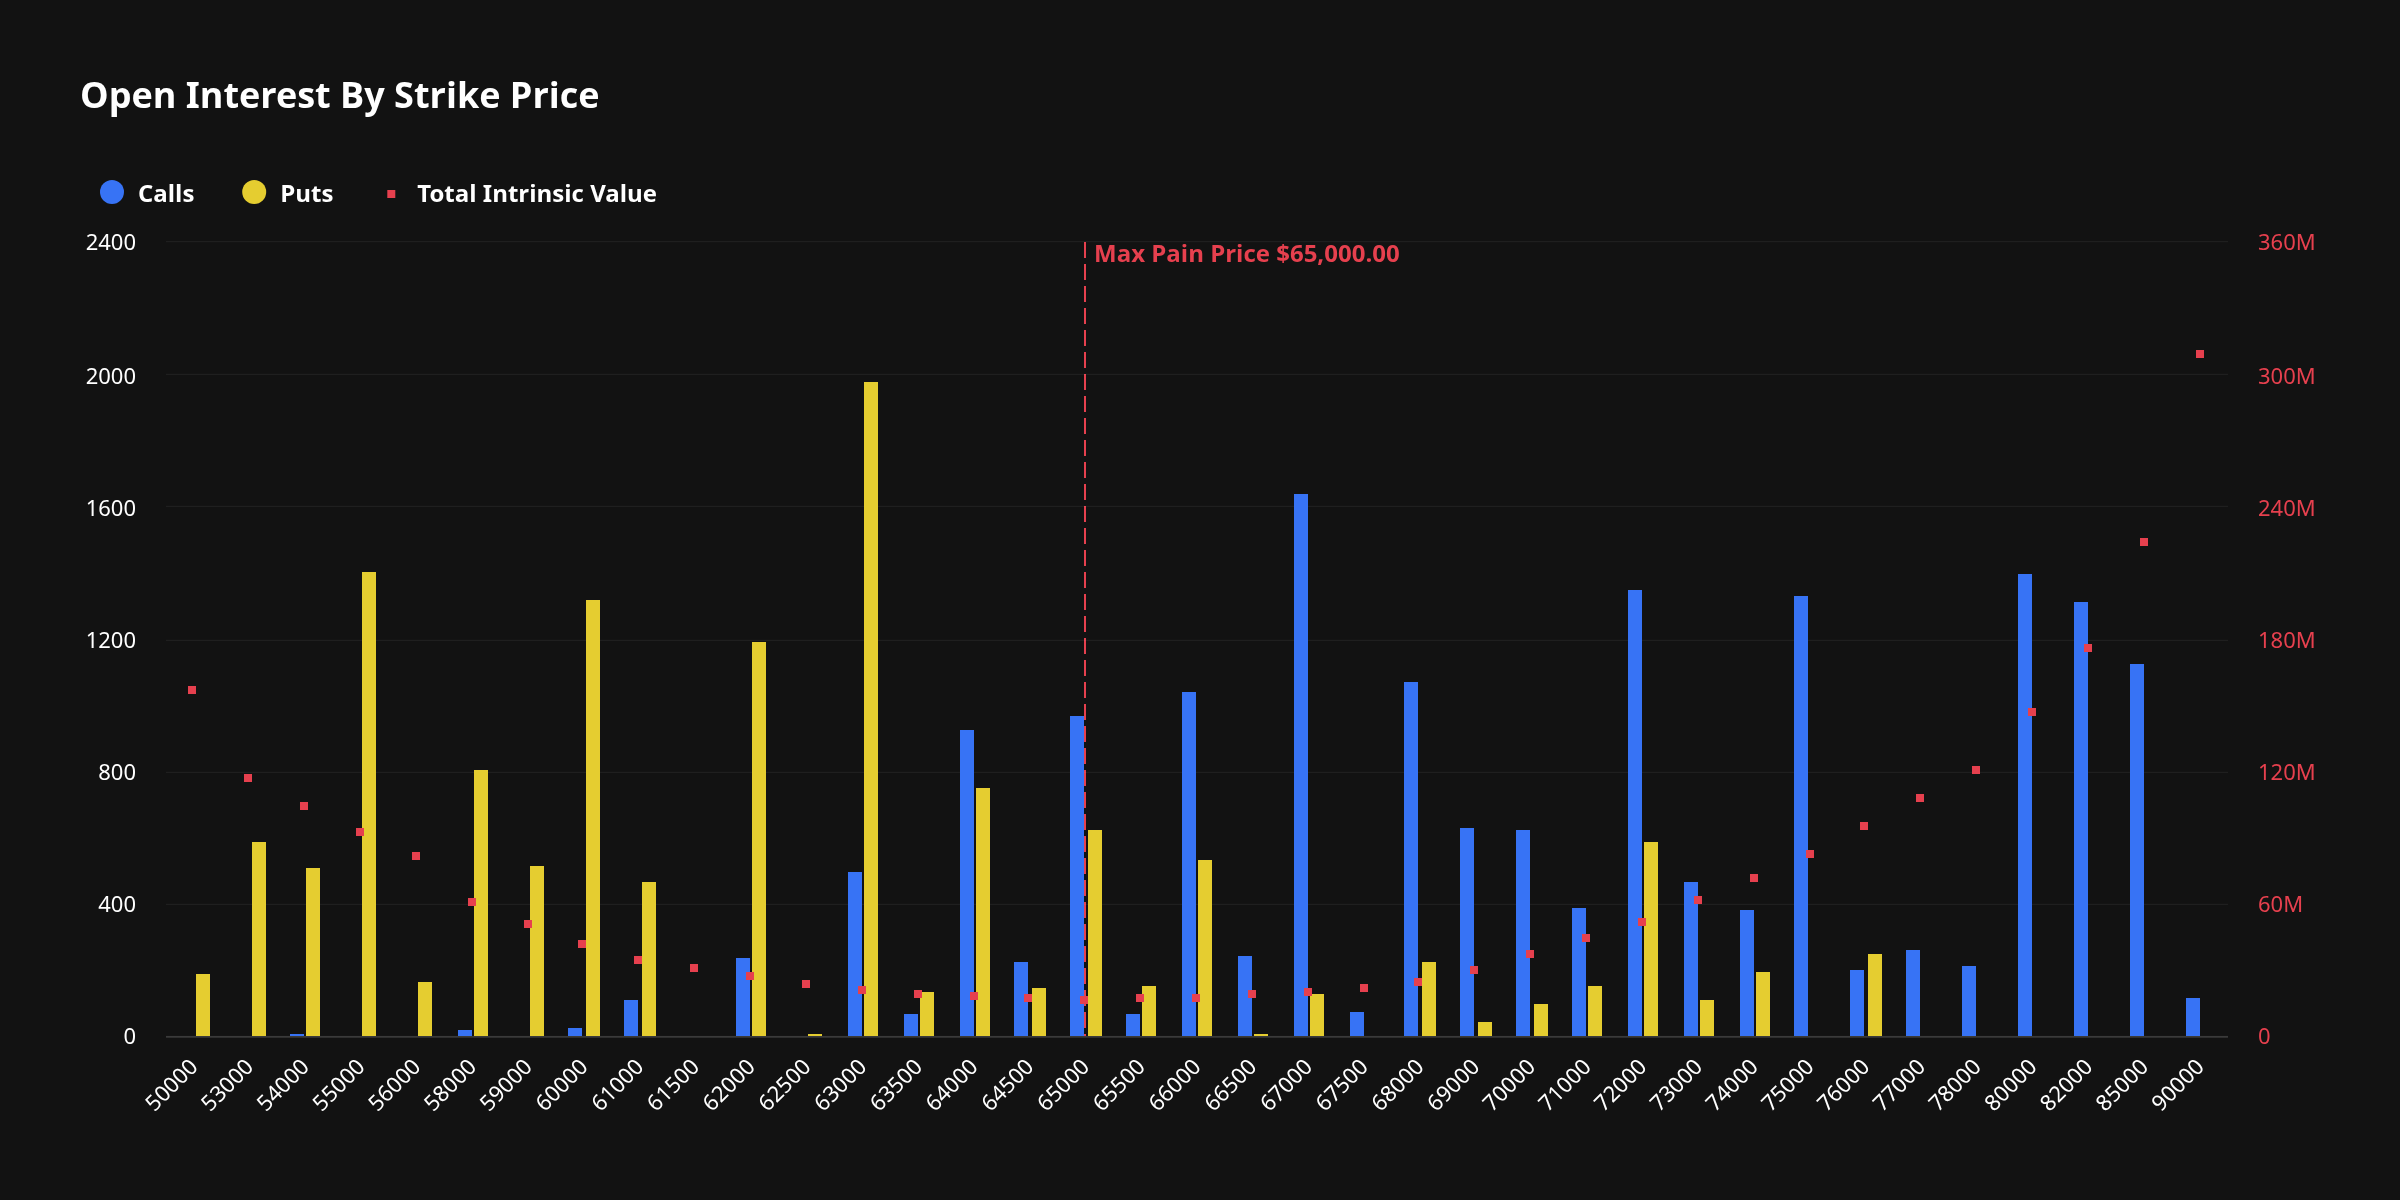
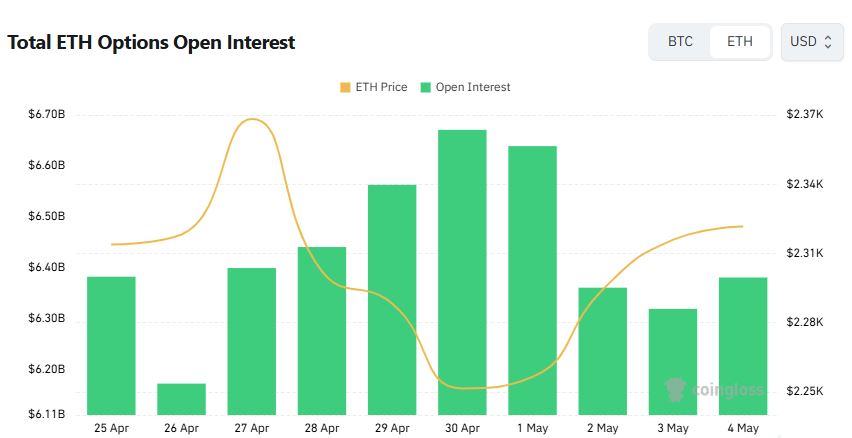
- Open interest (OI): The total number of outstanding derivatives contracts; rising OI can signal increasing leverage and positioning buildup.
- Funding rate: Periodic payments between longs and shorts in perpetual futures; can indicate which side is crowded.
- Heatmap (liquidation heatmap): Visualization of likely liquidation/stop clusters across price levels, used to infer where forced flows may concentrate.


Comment 0