 News
News  Coin Information
  About us
  Customer Service


As oil prices rip higher amid the prolonged closure of the Strait of Hormuz, a familiar claim is resurfacing across crypto trading desks: when crude spikes, Bitcoin (BTC) must fall. The data suggest the relationship is far less direct—and the real driver is not energy itself, but the tightening or loosening of global ‘liquidity’ that oil shocks can trigger.
The energy backdrop is severe. More than a month after disruptions around the Strait of Hormuz constrained flows, Brent crude has pushed above $110 per barrel, while diesel prices have surged roughly 150%, according to figures cited in the Korean commentary. The move has revived fears of a broad inflation reacceleration just as major central banks had been looking for room to ease.
Yet the idea that Bitcoin mechanically tracks oil in the opposite direction does not hold up under longer-term scrutiny. Binance Research, citing a decade of weekly data, has found the correlation between Bitcoin returns and crude oil returns to be effectively zero—implying the two assets generally move independently rather than as predictable counterparts.
Recent price action underlines the point. Between Feb. 23 and March 18 (UTC), Brent jumped more than 46%, while Bitcoin rose about 15% over the same window, outperforming both the Nasdaq Composite and gold, according to the analysis referenced in the piece. If higher oil automatically meant lower Bitcoin, that episode alone would invalidate the rule-of-thumb.
Where a meaningful positive correlation did appear—roughly 2020 through 2022—was an unusual period in which extraordinary global monetary expansion pushed most ‘risk assets’ to respond to one dominant factor: abundant liquidity. Traders who internalized that regime can be tempted to project it onto today’s market, mistaking a temporary macro alignment for a durable oil-Bitcoin linkage.
The more accurate chain of causality runs through inflation expectations and central bank reaction functions. Sustained oil price increases tend to lift forward inflation expectations, which in turn makes it harder for central banks to cut rates. If rate cuts are delayed—or if hikes return to the table—financial conditions tighten and global liquidity contracts. For an asset like Bitcoin, which has no intrinsic cash flow and is often traded as a high-beta macro proxy, that liquidity impulse can matter far more than the oil chart itself.
That indirect channel is now taking center stage. The commentary points to futures pricing that assigns a high probability—around 70%—that the Federal Reserve could raise rates in 2026 rather than cut, alongside a rise in the 10-year U.S. Treasury yield to levels not seen since the outbreak of war referenced in the report. Markets have also begun pricing an extended period of policy ‘hold’ over the next 18 months. The implication for crypto is straightforward: tighter expected policy paths compress liquidity—and that tends to weigh on Bitcoin and other risk assets.
The episode is also sharpening a long-running identity debate around Bitcoin’s role as an inflation hedge. In the current oil-driven inflation scare, Bitcoin has traded more like technology equities than like a traditional store of value, with the Korean analysis citing an 85% correlation with the Nasdaq 100 in 2026. Gold, by contrast, has behaved more like a classic safe haven: the report notes gold surged about 65% in 2025 while Bitcoin fell roughly 6% over the same period, and that Bitcoin’s correlation with gold flipped to a strongly negative reading of -0.69 at the start of 2026.
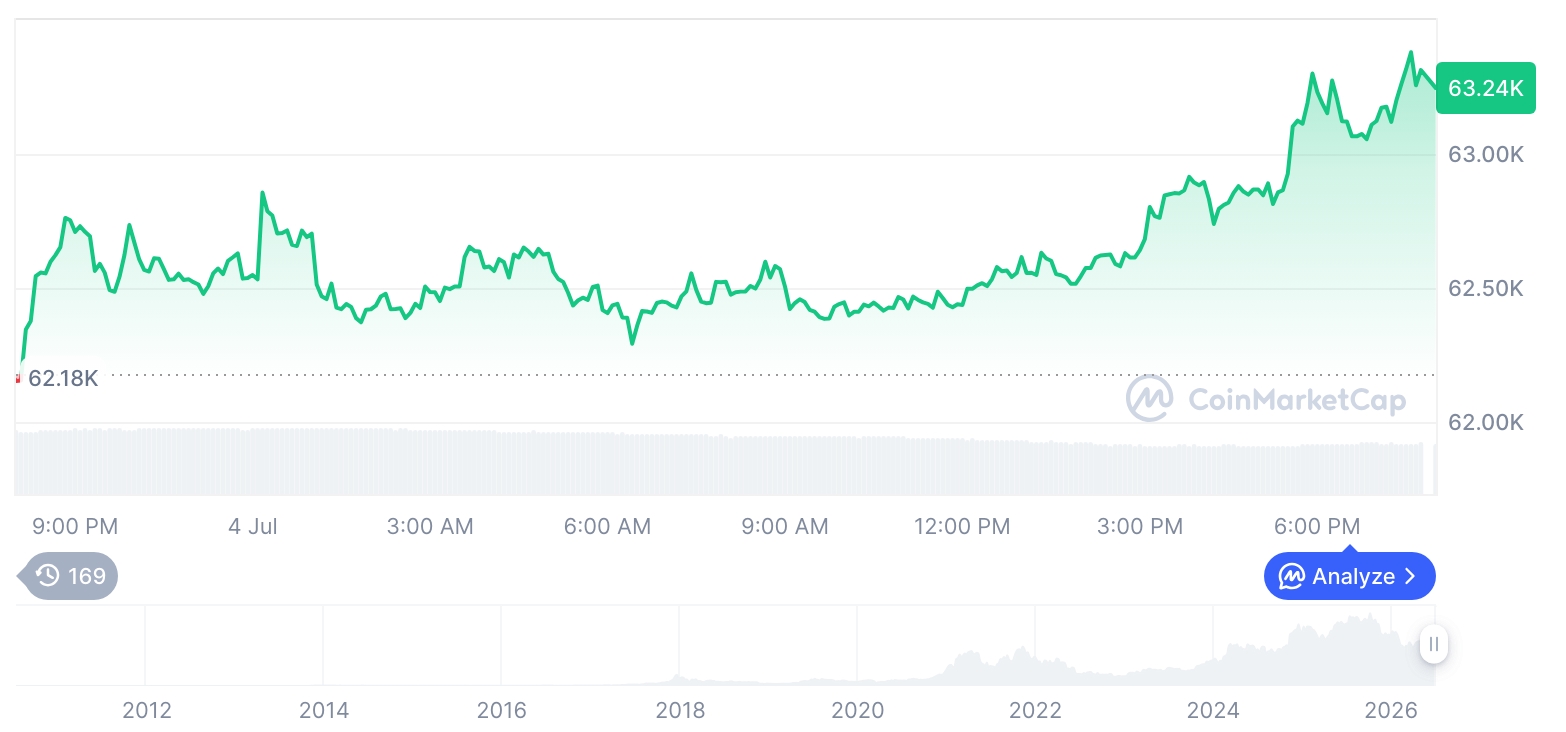
Bitcoin’s broader cycle context adds to the fragility. After pushing above $100,000 late in 2025, BTC has trended lower through 2026 in the analysis, even as oil—driven by geopolitics and supply shocks—has been one of the year’s best-performing assets. The divergence has undercut the narrative that Bitcoin reliably protects purchasing power during inflationary stress, at least in the short run.
To be sure, traders can point to repeated historical patterns in which geopolitical crises produced an initial Bitcoin drawdown followed by a strong bounce. During the Russia-Ukraine war in 2022, the commentary recalls oil rallying roughly 50% while Bitcoin fell about 18%, then rebounded around 40%. After attacks in October 2023, it says Bitcoin sold off briefly before recovering to roughly $35,000 within a month.
But the piece argues that extrapolating “buy the crisis dip” can be dangerous if the real shock is not the headline event but the policy tightening that follows. In 2022, it argues, the oil spike mattered less than the subsequent tightening cycle it helped catalyze—one that ultimately contributed to a longer drawdown, trapping investors who mistook a short-term relief rally for a durable trend reversal.
Another risk cited is a potential second leg in oil’s rally if temporary buffers are exhausted. The International Energy Agency (IEA) released a historically large 400 million barrels from strategic reserves on March 11 (UTC), according to the commentary. BCA Research, it adds, has flagged around April 19 (UTC) as a key window when both reserve releases and temporary waivers on Russian crude could fade—raising the prospect of an ‘oil cliff’ in which prices face renewed upward pressure.
If that scenario materializes, the market sequence may be familiar: oil moves first, bond yields react, equities reprice, and crypto follows—often amplifying the broader risk-off impulse. For Bitcoin, the key variable would not be crude itself but whether the inflation impulse forces the Fed into a more restrictive posture for longer, tightening global liquidity conditions.
In that sense, watching oil can still matter for crypto investors—but not as a simplistic timing signal to buy or sell Bitcoin on every crude spike. The more relevant question is how energy-driven inflation shocks reshape monetary policy expectations and the liquidity regime that ultimately sets the tone for BTC’s risk appetite across global markets.
🔎 Market Interpretation
- Oil spikes don’t mechanically mean BTC falls: Long-run data (about a decade of weekly observations cited) show near-zero correlation between Bitcoin and crude returns, undermining the “oil up, BTC down” desk rule.
- The real transmission channel is liquidity: Oil-driven inflation pressure can delay rate cuts or revive hike risk, tightening financial conditions and shrinking global liquidity—often the dominant driver for high-beta assets like BTC.
- Regime confusion risk (2020–2022): The period where BTC and oil looked more related was largely a liquidity-dominated macro regime; projecting that temporary alignment onto today can lead to incorrect positioning.
- Recent episode contradicts the shortcut: In the cited Feb 23–Mar 18 window, Brent surged (~46%) while BTC also rose (~15%), outperforming Nasdaq and gold—showing crude strength can coexist with BTC gains.
- Policy expectations are the current headwind: The piece highlights futures implying elevated odds of tighter Fed policy in 2026 and a prolonged “hold” baseline, which would restrain liquidity and weigh on crypto risk appetite.
- BTC behaving like equities, not gold: During the oil/inflation scare, Bitcoin has traded more like tech (high reported correlation with Nasdaq 100) while gold acted as the classic safe haven; BTC–gold correlation is described as turning strongly negative.
💡 Strategic Points
- Trade the policy reaction, not the commodity chart: Use oil as an inflation expectations indicator—watch how it alters rate-cut timing, terminal rate pricing, and real yields rather than assuming a direct BTC inverse.
- Monitor the sequencing of risk-off: The article’s proposed chain is oil → yields → equities → crypto. If yields and equities start repricing, BTC may amplify the move.
- Stress-test “buy the crisis dip”: Historical rebounds after geopolitical shocks can be followed by deeper drawdowns if the oil shock triggers a sustained tightening cycle (as argued for 2022).
- Key dashboards for crypto investors:
- Fed funds futures / OIS curve: changes in expected cuts vs hikes.
- 10Y U.S. Treasury yield and real yields: proxy for discount-rate pressure on risk assets.
- Inflation breakevens (e.g., 5Y5Y): whether oil is lifting long-run inflation fear.
- Equity risk tone (Nasdaq leadership, credit spreads): confirms broader liquidity tightening.
- Watch for a second oil leg (“oil cliff” risk): Strategic reserve releases and temporary supply waivers may fade around the cited window, potentially re-accelerating oil and reigniting the policy-tightening narrative.
- Portfolio framing: If BTC trades as a high-beta macro asset in this regime, hedging or sizing should be closer to an equity-risk play than an inflation-hedge allocation—until correlations shift again.
📘 Glossary
- Global liquidity: Broad availability of funding and ease of financial conditions, influenced by central bank policy, credit creation, and risk appetite; often a key driver of risk-asset performance.
- Financial conditions: The combined effect of interest rates, credit spreads, equity valuations, and the dollar on economic and market activity; tighter conditions typically pressure risk assets.
- Inflation expectations: Market-implied or surveyed forecasts of future inflation; higher expectations can reduce the likelihood of rate cuts and increase tightening risk.
- Central bank reaction function: The policy pattern describing how a central bank adjusts rates in response to inflation, growth, and employment data (and shocks like energy spikes).
- High-beta asset: An asset that tends to move more than the broader market; BTC is often treated as high-beta to liquidity and risk sentiment.
- Correlation: A statistic describing how two assets move together (from -1 to +1). Near zero suggests no consistent relationship; negative means they often move oppositely.
- Safe haven: An asset expected to hold value during risk-off or inflation shocks (gold is commonly cited), contrasted with risk assets like equities/crypto.
- Strategic Petroleum Reserve (SPR) release: Government use of stored crude to temporarily increase supply and moderate prices; expiration can remove a buffer and re-tighten the market.


Comment 0