 News
News  Coin Information
  About us
  Customer Service


Pearl (PRL) surged nearly 160% over the past week in Bitcoin (BTC)-denominated trading, leading a broader risk-on rotation into smaller-cap tokens as short-term momentum clustered in a handful of names. The move stood out not only for its magnitude but also for how concentrated weekly winners were in BTC markets—often a sign that speculative flows are chasing volatility rather than broader, fundamentals-driven demand.
The snapshot, based on an exchange’s digital asset analytics as of May 22 at 00:05 ET, showed Pearl (PRL/BTC) up 159.79% week-on-week, followed by KernelDAO (KERNEL/BTC) gaining 94.59% and SurfingT (PROVE/BTC) rising 62.25%. Other notable weekly gainers included Pharos (PROS/BTC) (+57.36%), Reserve Rights (RSR/BTC) (+50.00%), Mask Network (MASK/BTC) (+46.96%), Alpha Quark (AQT/BTC) (+37.29%), NKN (NKN/BTC) (+33.33%), and Near Protocol (NEAR/BTC) (+30.07%).
While the weekly leaderboard skewed heavily toward BTC pairs, the Korean won (KRW) market also produced a prominent outlier: OriginTrail (TRAC/KRW) climbed 48.42% over the same period. The divergence underscores how liquidity can fragment across quote currencies, with BTC markets sometimes acting as a faster conduit for short-term positioning when traders rotate into higher beta assets.
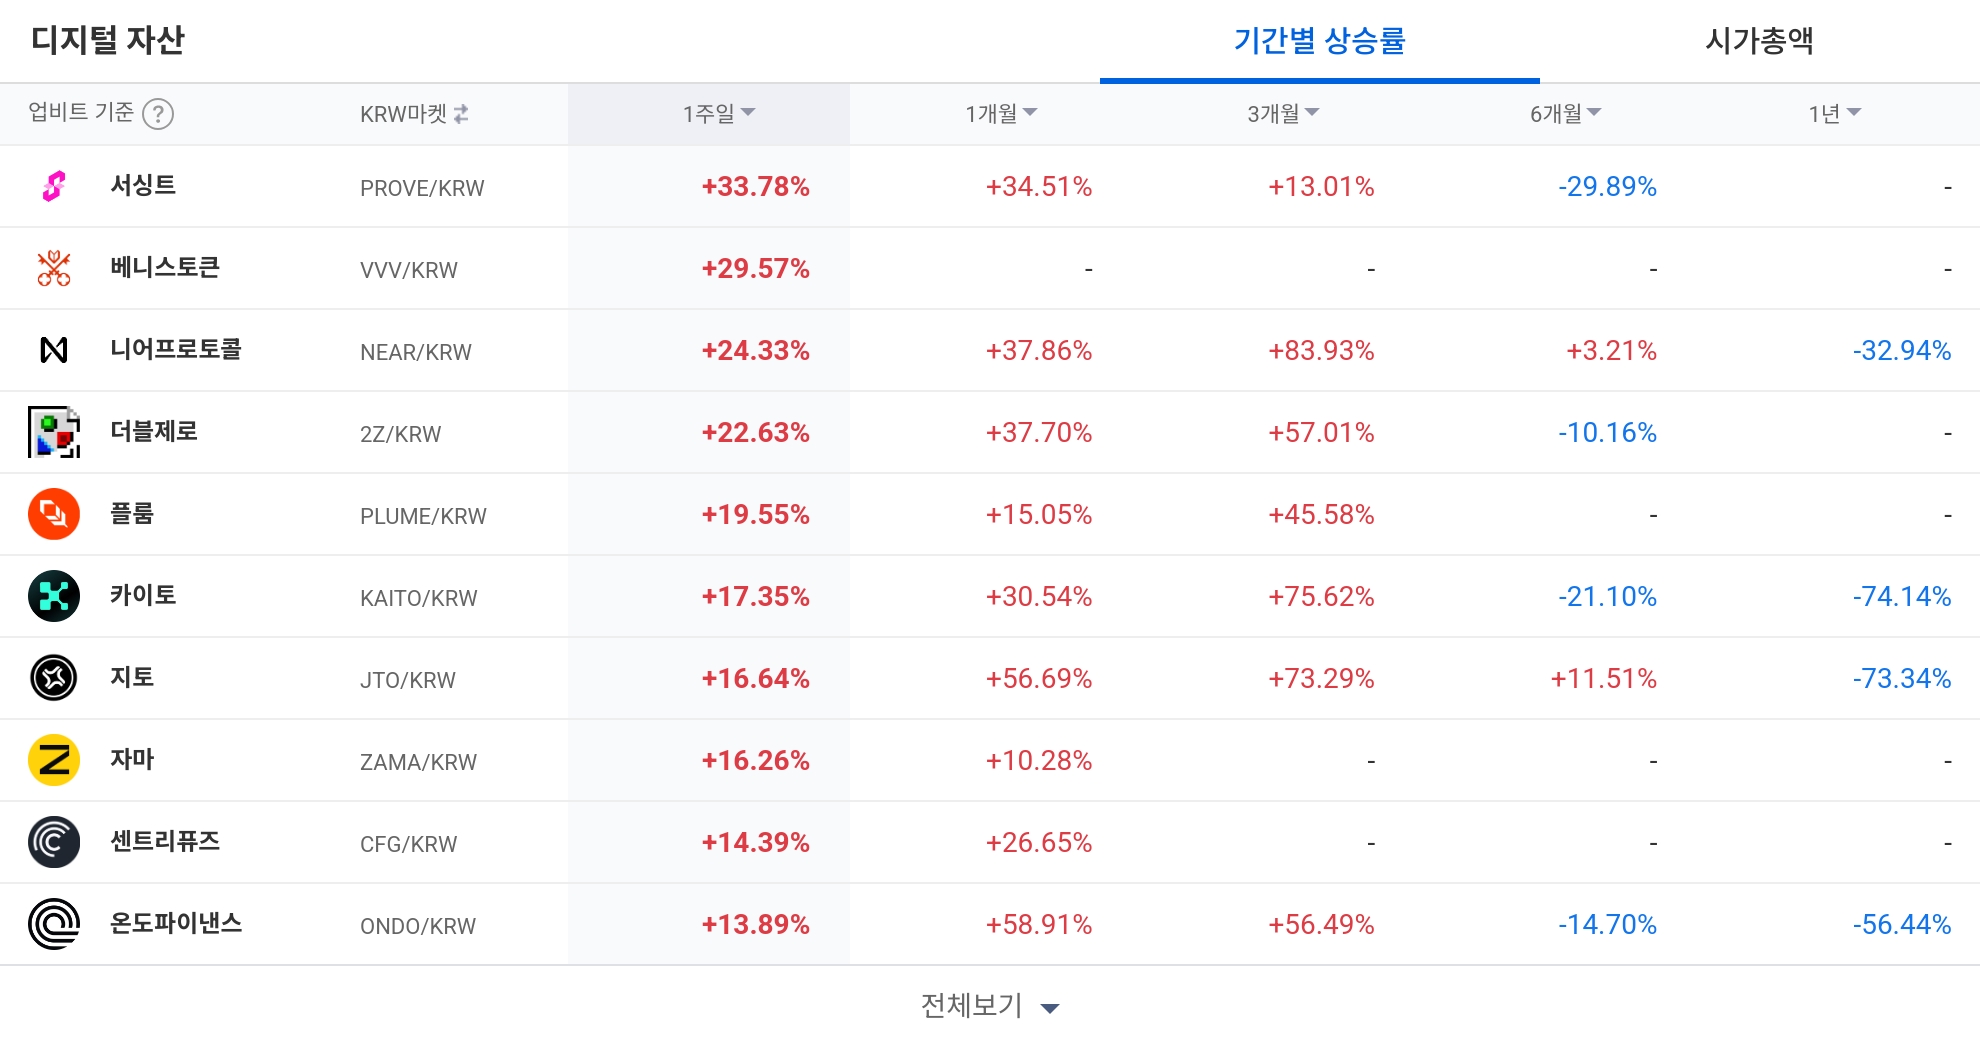
Across longer time windows in KRW pairs, SurfingT (PROVE/KRW) posted steady gains, rising 33.78% over one week and 34.51% over one month, while remaining up 13.01% over three months—suggesting a more consistent trend profile than the week’s most explosive movers. Near Protocol (NEAR/KRW) advanced 24.33% over one week and 37.86% over one month, and was up 83.93% over three months, though it remained down 32.94% over one year, highlighting the gap that can open between medium-term rebounds and the longer cycle. Ondo Finance (ONDO/KRW) increased 13.89% over one week and 58.91% over one month, and was up 56.49% over three months; however, it was still down 14.70% over six months and 56.44% over one year, indicating a sizeable drawdown despite the recent recovery.
The exchange noted that returns are calculated only for markets with sufficient price history for the selected period, meaning newly listed pairs may not show full interval data until enough time has elapsed. That methodological detail matters when traders compare multi-period performance, as blank fields can reflect listing timing rather than a lack of price movement.
Order-flow indicators also flashed unusually extreme readings. In the daily ‘buy trade strength’ ranking—a metric reflecting the balance of buy-initiated versus sell-initiated executions—Plasma (XPL/KRW), Mantle (MNT/KRW), Caldera (ERA/KRW), IOTA (IOTA/KRW), and Polkadot (DOT/KRW) all registered 500.00%, the top-of-scale value in the dataset. Such ceiling readings can occur when market buys dominate prints, but they can also be amplified by thin order books, sudden bursts of market orders, or price gaps that distort execution patterns.
Conversely, the daily ‘sell trade strength’ list showed Status (SNT/KRW), Bitcoin SV (BSV/KRW), JUST (JST/KRW), STEPN (GMT/KRW), and Creditcoin (CTC/KRW) at 0.00%, an opposite extreme that typically suggests sell-initiated executions overwhelmingly dominated at the measurement point or that buy-side executions were negligible. In practice, both 0% and 500% readings tend to cluster around short-lived dislocations, reinforcing the need to assess ‘liquidity’ conditions—such as volume concentration and order-book depth—alongside headline returns.
Overall, the data depicted a market where weekly breakouts were concentrated in BTC pairs, while KRW-based multi-period leaders like PROVE, NEAR, and ONDO signaled a parallel rebound in select large and mid-cap narratives. The prevalence of extreme execution-strength values suggests that parts of the market may have been driven by short-term positioning and microstructure effects, leaving price action more sensitive to sudden reversals if liquidity thins or momentum fades.


Comment 0