
 Add as a preferred source on Google
Bitcoin caught between $80,000 support and $88,000 supply wall
Bitcoin is trading between overlapping support at $80,000-$81,500 and break-even supply near $88,000. ETF outflows have weakened spot demand, though long-term-holder realized losses are down about 85%.


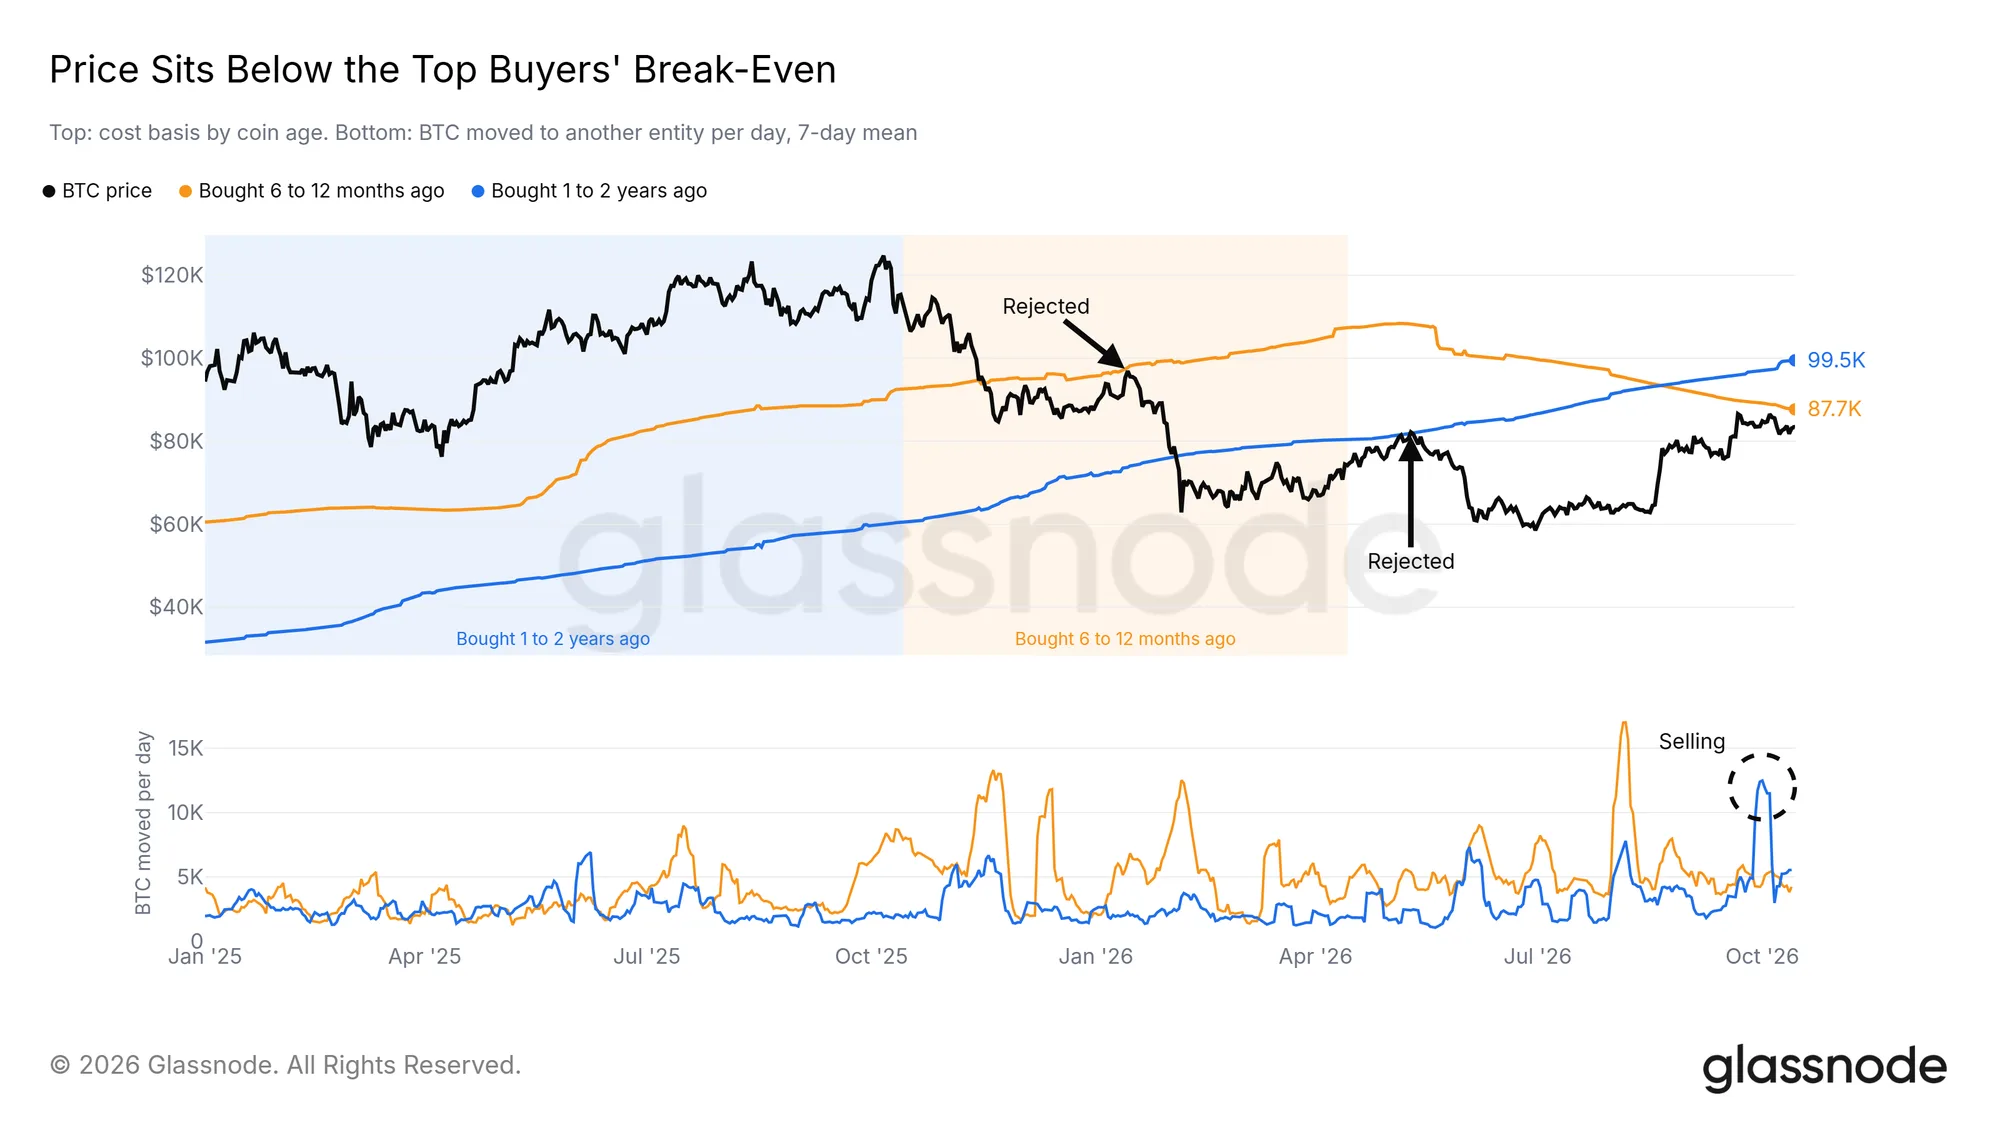
Bitcoin is searching for direction between support at $80,000-$81,500 and a supply wall near $88,000. Spot demand has weakened amid ETF outflows, while loss-taking by long-term holders has fallen sharply.
In its “Boxed In” report published on October 14, 2026, Glassnode said Bitcoin was pinned between overlapping order-book and on-chain support below and break-even selling overhead. Investors who bought six to 12 months ago have an average cost basis of about $88,000, while the cost basis of those who bought one to two years ago is near $100,000.
Bitcoin reached the six-to-12-month holder cost basis in January before falling by more than one-third. It touched the one-to-two-year holder cost basis in May and then dropped about 25%. The latter group also increased selling during the rally at the start of October. Until Bitcoin closes above $88,000, advances are likely to encounter supply from holders selling near break-even.
Overlapping support at $80,000-$81,500
Bitcoin remains above the True Market Mean, the average cost basis of active investors, near $78,000. It is also above the Short-Term Holder Cost Basis. The price has held above both measures since September 18, maintaining what Glassnode described as a bullish regime.
The average cost basis of U.S. spot ETFs is closer to the market at about $81,500. Bitcoin fell below that level intraday on October 8 and October 13 but recovered to close above it on both occasions. Every daily close since September 21 has remained above the line. A close below it would put the average ETF holder at a loss and remove the nearest on-chain support.
The largest block of bids on Binance’s spot order book now sits at $80,000. Bitcoin traded through the previous $81,000 bid wall on October 8, after which bids one level lower grew sharply and held. Order-book and on-chain support therefore overlap between $80,000 and $81,500.
A break below that zone could bring the liquidation cluster just under $80,000 into play, followed by the True Market Mean near $78,000.
Loss-taking fades as profitable supply dominates
Long-term holders have largely stopped selling at a loss. Their realized losses peaked on August 12 and have since fallen by about 85%. In 2022, the peak in realized losses came within weeks of the cycle low. As loss-taking has subsided, a growing share of coins changing hands is being sold at a profit.
The Spent Output Price Distribution groups each day’s spent coins by the price at which they last moved, showing where current supply originated. In every bear market since 2011, coins spent at a loss outnumbered those spent at a profit, while the reverse held in every bull market.
At the June low, coins spent at a loss outnumbered profitable coins by about 12 to one. The balance flipped in late August, and holders in profit now spend about four coins for every coin spent at a loss. Profit-taking can slow a rally, but the same balance persisted throughout previous bull markets.
ETF outflows weaken spot demand
U.S. spot ETFs stepped up buying after Bitcoin broke above $85,000 in late September. From September 21 through October 6, the funds recorded nearly $3 billion in net inflows, their fastest buying pace since November 2025.
That demand did not last. Since October 7, the funds have posted about $760 million in net outflows. With ETFs selling and higher-cost holders unloading near break-even, little fresh demand is supporting the price. Glassnode said a return to steady ETF inflows would be the clearest indication that demand has recovered.
Liquidation clusters gather near $80,000 and $88,000
Futures positioning leaves room for sharp moves in either direction. On the two-month liquidation heatmap, the shelf of leveraged liquidation levels around the current price thinned by more than 20% in one week. The largest remaining clusters, similar in size, sit just below $80,000 and near $88,000.
A move below $80,000 could trigger forced selling of long positions and deepen the decline. A rise toward $88,000 could force short sellers to buy back, temporarily extending the advance. That level also coincides with the six-to-12-month holder cost basis, and without spot demand, a short squeeze could run into selling from higher-cost holders and prove difficult to sustain.
During the 2018 and 2022 bear markets, Bitcoin spent months below the Realized Price, the average price paid for all coins in circulation. In the current bear market, it has never closed below that level. Even at its lowest close on June 30, Bitcoin stood about 10% above the Realized Price and further above the Long-Term Holder Cost Basis.
The comparatively shallow bottom meant the average Bitcoin holder never moved into a loss. With the price back above the True Market Mean and the Short-Term Holder Cost Basis, the cycle is showing signs of being in an early recovery phase.
This article is based on market data and chart analysis and does not constitute investment advice regarding any asset.
John Kim
John Kim reports on the digital-asset business for TokenPost. Send corrections or tips to info@tokenpost.com.