 News
News  Coin Information
  About us
  Customer Service


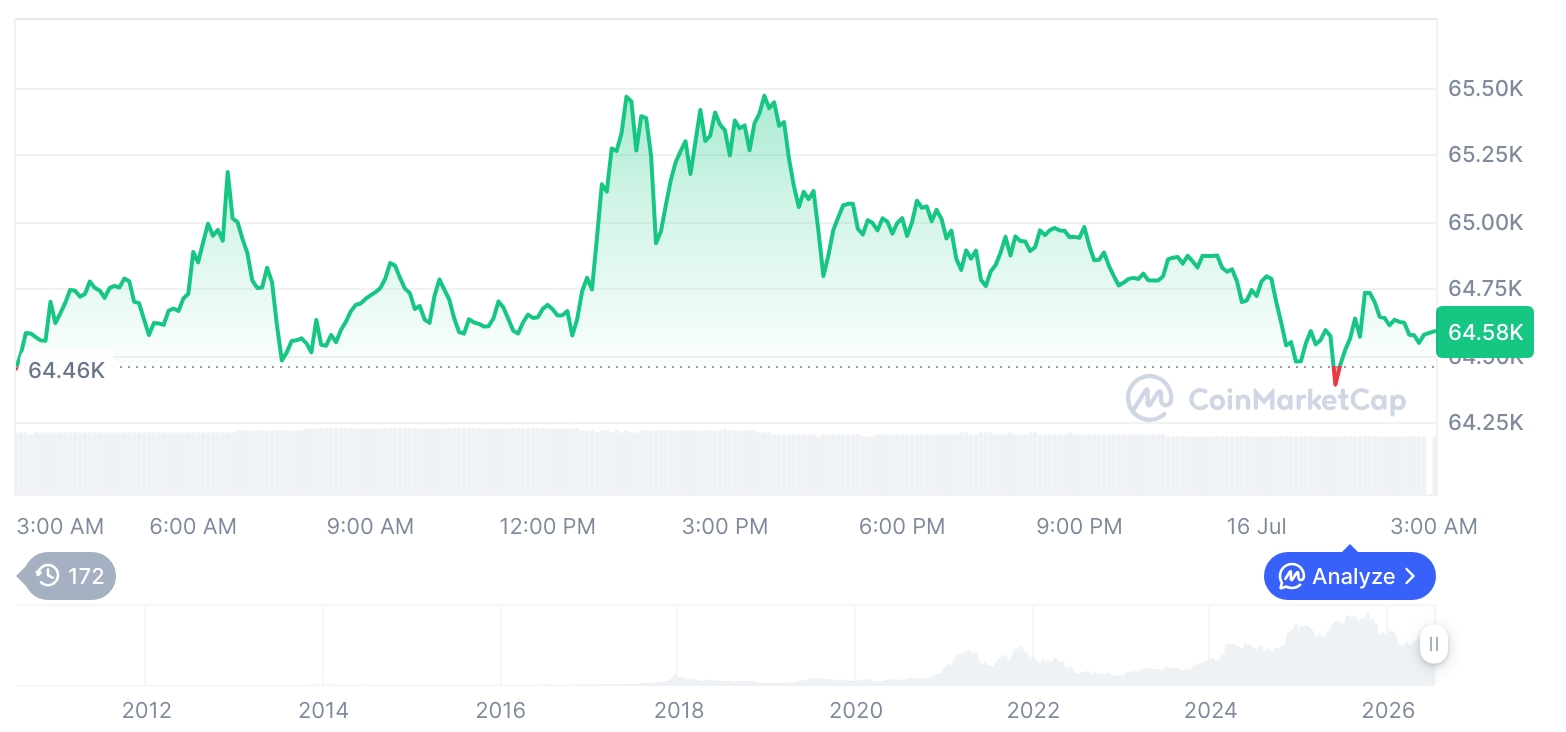
Bitcoin (BTC) is showing signs of vulnerability after a three-week rebound, as broader market signals point to potential downside risk. Despite recovering from lows near $80,000 on November 21 and climbing back above $90,000, BTC’s recent price action suggests the rally may be losing momentum. The bounce formed a rising channel with higher highs and higher lows, but it remains a countertrend move within a broader downtrend, leaving Bitcoin exposed to a possible reversal.
The recovery initially looked promising. A weaker U.S. dollar following the Federal Reserve’s rate cut and longer-term technical indicators hinted at a potential bullish shift in Bitcoin momentum. However, these supportive factors failed to ignite a sustained rally. Instead, BTC faced strong selling pressure, falling from around $93,000 on Friday to nearly $88,000 by Sunday, before stabilizing near $89,600.
From a technical perspective, Bitcoin ended last week with a bearish candlestick featuring a long upper wick and a small red body. This pattern signals rejection near the $94,000 level and reflects fading bullish strength, reinforcing a “sell-the-rallies” market structure. The failure to hold above key resistance levels raises the probability of a deeper pullback.
Adding to the caution is the Nasdaq’s recent performance. The tech-heavy index dropped nearly 2% last week, forming a bearish engulfing pattern on the weekly chart alongside a bearish MACD signal. Given Bitcoin’s strong positive correlation with the Nasdaq—especially during equity downtrends—continued weakness in U.S. tech stocks could amplify downside pressure on BTC.
Another warning sign comes from the MOVE index, which tracks volatility in U.S. Treasury markets. The index printed an inverted hammer candlestick after a prolonged decline, often interpreted as an early signal of rising volatility. Historically, higher Treasury volatility has tightened financial conditions and weighed on risk assets like Bitcoin, which tends to move inversely to the MOVE index.
Overall, Bitcoin appears more likely to break below its countertrend channel, opening the door for a retest of the $80,000 support zone. To regain short-term bullish momentum, BTC must decisively clear the $94,000–$95,000 range, though significant resistance remains between $96,000 and $100,000, including the 50-day simple moving average and the Ichimoku cloud.


Comment 0