 News
News  Coin Information
  About us
  Customer Service


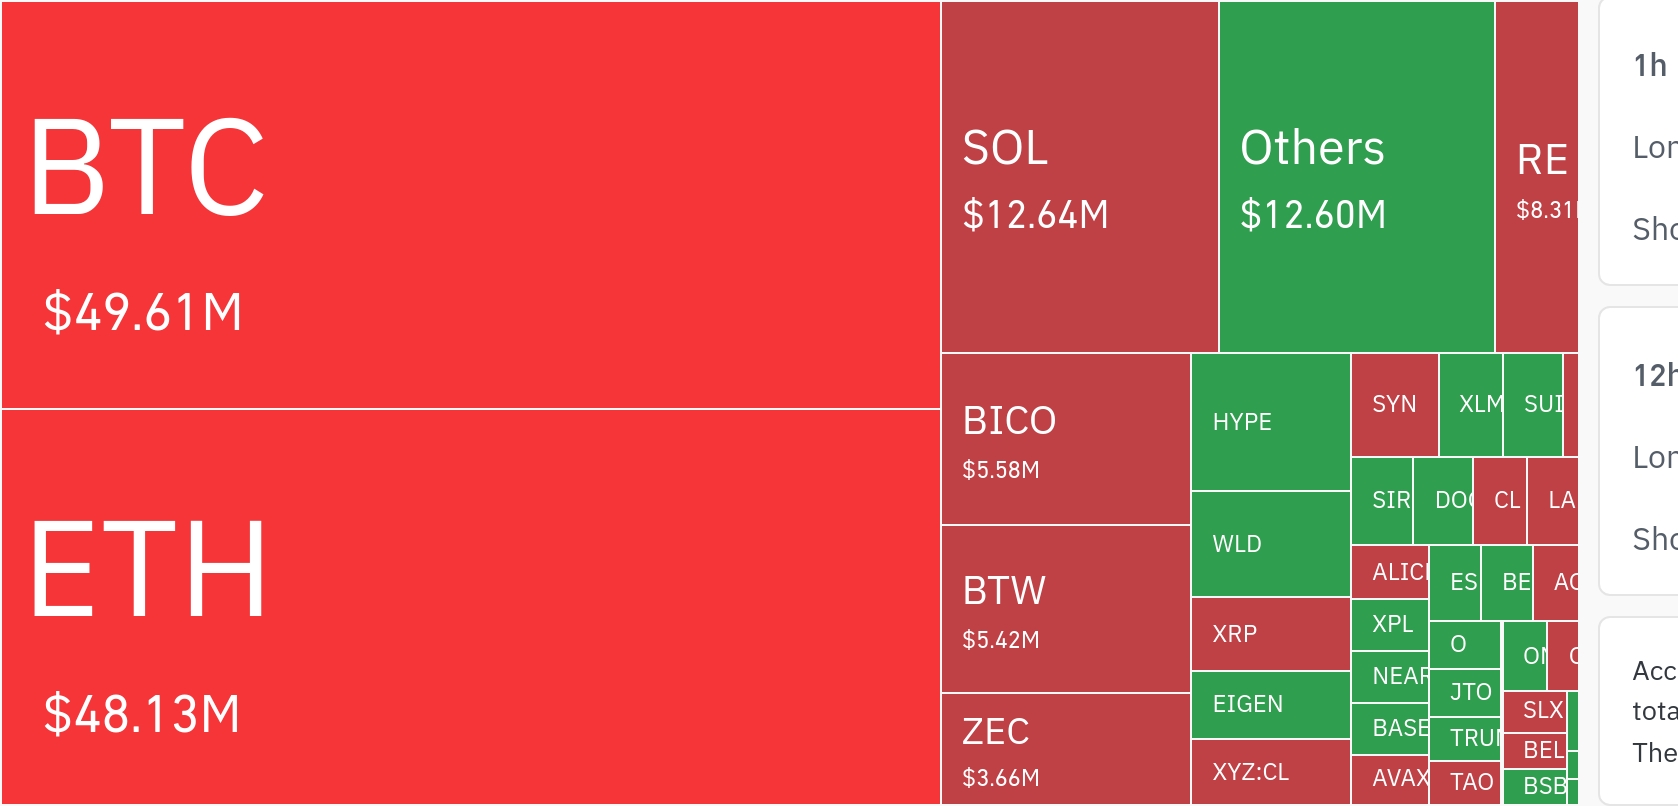
Crypto Telegram communities swung between aggressive 'signal-driven' trading and heightened macro caution this week, as users circulated screenshots claiming double-digit gains on Bittensor (TAO) and then immediately turned to the market’s 'Extreme Fear' sentiment reading and escalating Middle East headlines.
The discussion was captured by the KOL Index, a community-trend series produced using TokenPost and DataMaxiPlus analytics that tracks which posts draw the most attention from investors on Telegram. The latest snapshot shows a market trying to reconcile short-term rebound hopes with renewed risk management focus as geopolitical risk re-entered the narrative.
TAO “profit proof” goes viral, reinforcing a signal culture
The fastest-spreading topic centered on a TAO/USDT long setup that was framed as execution rather than speculation, accompanied by a screenshot claiming the first target had been reached. The post laid out a specific entry band around 266.0–268.3, a first take-profit level near 272.8, and a stop-loss around 258.7—then quickly followed with a “Target 1 hit” update that users described as an informal ‘profit verification’ (around 11% on a leveraged basis, according to the post).
Technical justification circulated alongside the trade call in a familiar checklist format—daily trend described as bullish, a “mildly rising” 4-hour structure, an EMA ribbon alignment, MACD golden cross references, and rebound narratives tied to support near the lower Bollinger Band. The repetition mattered as much as the content: the same indicators were echoed across chats, suggesting the community was not simply discussing TAO, but reaffirming a broader preference for templated technical setups.
Altcoin charts flood the feed: “hold support or break lower” becomes the dominant frame
Beyond TAO, posts analyzing Quant (QNT), Optimism (OP), Ethereum (ETH), Aave (AAVE), Hyperliquid (HYPE), Aptos (APT), Injective (INJ), dogwifhat (WIF), and Kaspa (KAS) appeared in rapid succession. Most used the same structure: RSI, MACD, and Bollinger Band positioning, anchored to one or two key price levels presented as the next inflection point.
Several examples stood out. QNT was described as “hugging” the upper band while RSI hovered near the low 70s, prompting warnings of a possible short-term cooldown even amid strength. ETH commentary leaned more defensive, citing an RSI around 39 and bearish MACD signals, with discussion coalescing around whether the 2,114 level would hold as support. For AAVE and INJ, users emphasized the downside risk if lower-band support failed, while APT and WIF were framed as structurally steadier—but only conditionally, with repeated caveats that a break of core support would invalidate the bullish scenario.
ENA short and RENDER long follow the same playbook—then claim “Target 1” as validation
The signal narrative broadened as ENA/USDT short and Render (RENDER)/USDT long setups were shared with similarly precise parameters. ENA short entries were posted near 0.1021–0.1025 with a first target around 0.1012 and a stop near 0.1040. RENDER long entries were shared around 1.69–1.70 with a first target near 1.72 and a stop around 1.66. Both were followed by “Target 1 achieved” updates, which community members used to argue that the framework’s credibility lies in ‘clear entry, stop, and multi-target’ structure—then reinforced by rapid performance screenshots.
‘Extreme Fear’ returns to the timeline as traders weigh relief-rally odds
Alongside individual trade calls, a morning-brief style post summarizing broader market conditions also gained traction. It cited a total crypto market capitalization near $2.50 trillion and Bitcoin (BTC) dominance around 56.5%, while highlighting a Fear & Greed Index reading of 12/100, labeled 'Extreme Fear'.
On BTC, the tone was mixed: the prevailing view described weak technical posture—price near the lower Bollinger Band and RSI below 50—yet some posts pointed to a short-term MACD golden cross as a potential catalyst for a 'relief rally'. Price-level “checklists” circulated, including support around 70,539, resistance near 70,909, and a downside-warning level near 69,731.
Middle East risk re-enters the crypto conversation, with Hormuz and President Trump cited
Geopolitics provided the other major catalyst for caution. Community posts referenced Iran-related developments involving the Strait of Hormuz and circulated headlines about President Trump commenting on a potential gradual scaling back of U.S. military operations related to Iran in the Middle East. While some users interpreted the tone as a hint that conflict pressures could ease—linking that hope to modest BTC stabilization—others stressed that the messaging appeared preliminary and non-committal, reinforcing a wait-and-see stance ahead of weekend liquidity conditions.
Overall, the KOL Index snapshot showed Telegram attention clustering around “target hit” signal posts in TAO, ENA, and RENDER, while a parallel stream of altcoin technical analysis hammered on the same binary: defend key support or face another leg down. With 'Extreme Fear' readings and Middle East risk cited in the same breath, the dominant mood was a blend of tactical dip-buying optimism and intensified short-term risk awareness.
🔎 Market Interpretation
- Telegram mood split: Communities oscillated between aggressive, template-based “signal” trading (with rapid “Target 1 hit” proof) and defensive positioning driven by Extreme Fear sentiment plus renewed Middle East geopolitical risk.
- Signal culture as the main engagement engine: Posts that included precise entry/stop/target ladders and follow-up screenshots produced the fastest propagation, suggesting performance validation is used as social proof and credibility currency.
- Market framed as binary: Across majors and alts, discussion converged on “hold key support or break lower,” with indicators (RSI/MACD/Bollinger Bands/EMA ribbons) used as a repeatable narrative template rather than bespoke analysis.
- Macro overlay raises the risk premium: Despite occasional “relief rally” talk (e.g., BTC MACD golden cross mentions), the Fear & Greed Index at 12/100 and Hormuz/Iran headlines kept attention on drawdown control and weekend liquidity risks.
💡 Strategic Points
- What drove attention: “Execution-style” trade calls (TAO long, ENA short, RENDER long) that published tight parameters and then posted Target 1 achieved updates—creating a repeatable loop of call → validation → replication.
- Risk management became part of the content: The most-shared setups emphasized stop-loss placement alongside targets, reflecting a community preference for trades that appear rules-based, especially under fear-heavy sentiment.
- Altcoin playbook uniformity: Rapid-fire chart posts across QNT, OP, ETH, AAVE, HYPE, APT, INJ, WIF, KAS used the same indicator stack; this can increase coordination but also raises the chance of crowded positioning when many act on similar triggers.
- Key levels dominated more than narratives: Examples included ETH focus on whether ~2,114 holds, and BTC checklists around ~70,539 support / ~70,909 resistance / ~69,731 downside warning—showing traders anchoring decisions to near-term inflection points.
- Operational takeaway for readers: In “Extreme Fear” regimes, communities tend to shorten time horizons, prioritize clear invalidation levels, and treat early target tags (“T1”) as a confidence reset—even if broader trend risk remains unresolved.
📘 Glossary
- KOL Index: A ranking/snapshot of posts drawing the most investor attention in Telegram communities, produced using TokenPost and DataMaxiPlus analytics.
- Signal / Signal culture: Community practice of sharing prescriptive trade setups (entry, stop, targets) intended for rapid execution and replication.
- Entry band: A price range where traders aim to open a position, rather than a single entry price.
- Stop-loss (SL): Predefined price level where a trade is exited to cap losses if the thesis fails.
- Take-profit (TP) / Target 1 (T1): Planned levels to realize gains; “T1 hit” is often used as social proof that a setup is working.
- Leveraged gain: Amplified profit/loss from borrowing to increase position size; screenshot claims can reflect leverage rather than spot performance.
- RSI (Relative Strength Index): Momentum oscillator (0–100) used to gauge overbought/oversold conditions; higher values can imply overheating.
- MACD / Golden cross: Trend/momentum indicator; a “golden cross” commonly refers to a bullish crossover signal (context-dependent in MACD vs moving averages).
- Bollinger Bands: Volatility bands around a moving average; price near the lower band is often discussed as “weakness/support test,” upper band as “strength/extension.”
- EMA ribbon: Multiple exponential moving averages plotted together to visualize trend alignment and potential support/resistance zones.
- Fear & Greed Index: Market sentiment gauge; 12/100 indicates Extreme Fear, often associated with defensive behavior and heightened volatility.
- BTC dominance: Bitcoin’s share of total crypto market capitalization; changes can indicate rotation between BTC and altcoins.
- Relief rally: Short-lived rebound during broader weakness, often driven by positioning, oversold conditions, or catalyst headlines.
- Weekend liquidity: Typically thinner trading conditions that can exacerbate volatility and slippage.


Comment 0