 News
News  Coin Information
  About us
  Customer Service


Solana (SOL) traded in a tight range around $86 on Saturday ET, underscoring a stalemate between muted price action and a network that continues to scale in both infrastructure and on-chain throughput. The disconnect has left traders watching for a near-term technical break while institutions weigh whether improving fundamentals justify renewed exposure.
As of 10:58 a.m. in Seoul on April 26 (1:58 a.m. UTC), SOL changed hands at $86.45, down 0.19% over the prior 24 hours. Solana’s market capitalization stood at roughly $49.78 billion—ranking seventh among crypto assets—while 24-hour trading volume was about $2.6 billion. The token is up 1.92% over the past week but down 29.33% over the last 90 days, and it remains roughly 71% below its January 2025 all-time high near $294.
Technically, SOL has been consolidating inside a $77 to $94 band. Analysts monitoring the three-day chart noted a compressed Bollinger Band setup, a pattern often associated with an impending volatility expansion. A decisive move above $94 is being framed as a potential trigger for a sequence of upside objectives—$120, $150, $190, and $240—though those targets are contingent on sustained follow-through rather than a brief spike.
On the downside, market watchers warn that a breakdown below the $77 support zone could open room toward $60, reflecting the still-fragile sentiment across high-beta altcoins. Some analysts put the odds of a move into the $92–$95 region within the next two weeks at around 65%, citing $88.10 as a key intermediate resistance level. Derivatives positioning has also drawn attention, with some data pointing to whales holding about 69.3% of positions on the long side—often interpreted as a constructive signal, but one that can also amplify liquidations if momentum turns.
Beyond price, Solana’s development roadmap remains a central narrative. The network is progressing toward its Firedancer upgrade, which aims to lift throughput from roughly 1,300 transactions per second (TPS) to an ambitious target of 1 million TPS—more than a 700x jump from current levels—with a full release targeted for 2026. In parallel, the Alpenglow upgrade has already been applied to mainnet, with proponents saying it cuts transaction finality to under 200 milliseconds and reduces validator operating costs from about $60,000 per year to near $1,000—lowering the barrier to participation and potentially improving decentralization dynamics.
Those infrastructure changes are designed to position Solana as a venue for high-frequency activity and large-scale payments. Network figures cited in recent market commentary estimate that Solana processed about $1.1 trillion in economic activity last quarter, including approximately $832 billion in stablecoin transaction volume. The same data suggests tokenized equities issuance is heavily concentrated on Solana, with claims that 99% of tokenized stocks were minted on the chain—an indicator of traction in niche but fast-developing on-chain capital markets.
Institutional brand names have also featured in the Solana narrative. JP Morgan and Western Union have been cited as selecting Solana for payment-related infrastructure, highlighting the industry’s broader focus on settlement speed and cost efficiency. Even as some meme-token activity has reportedly migrated elsewhere, ecosystem expansion has continued, with 416 new projects added in the first quarter, according to the figures referenced in the report.
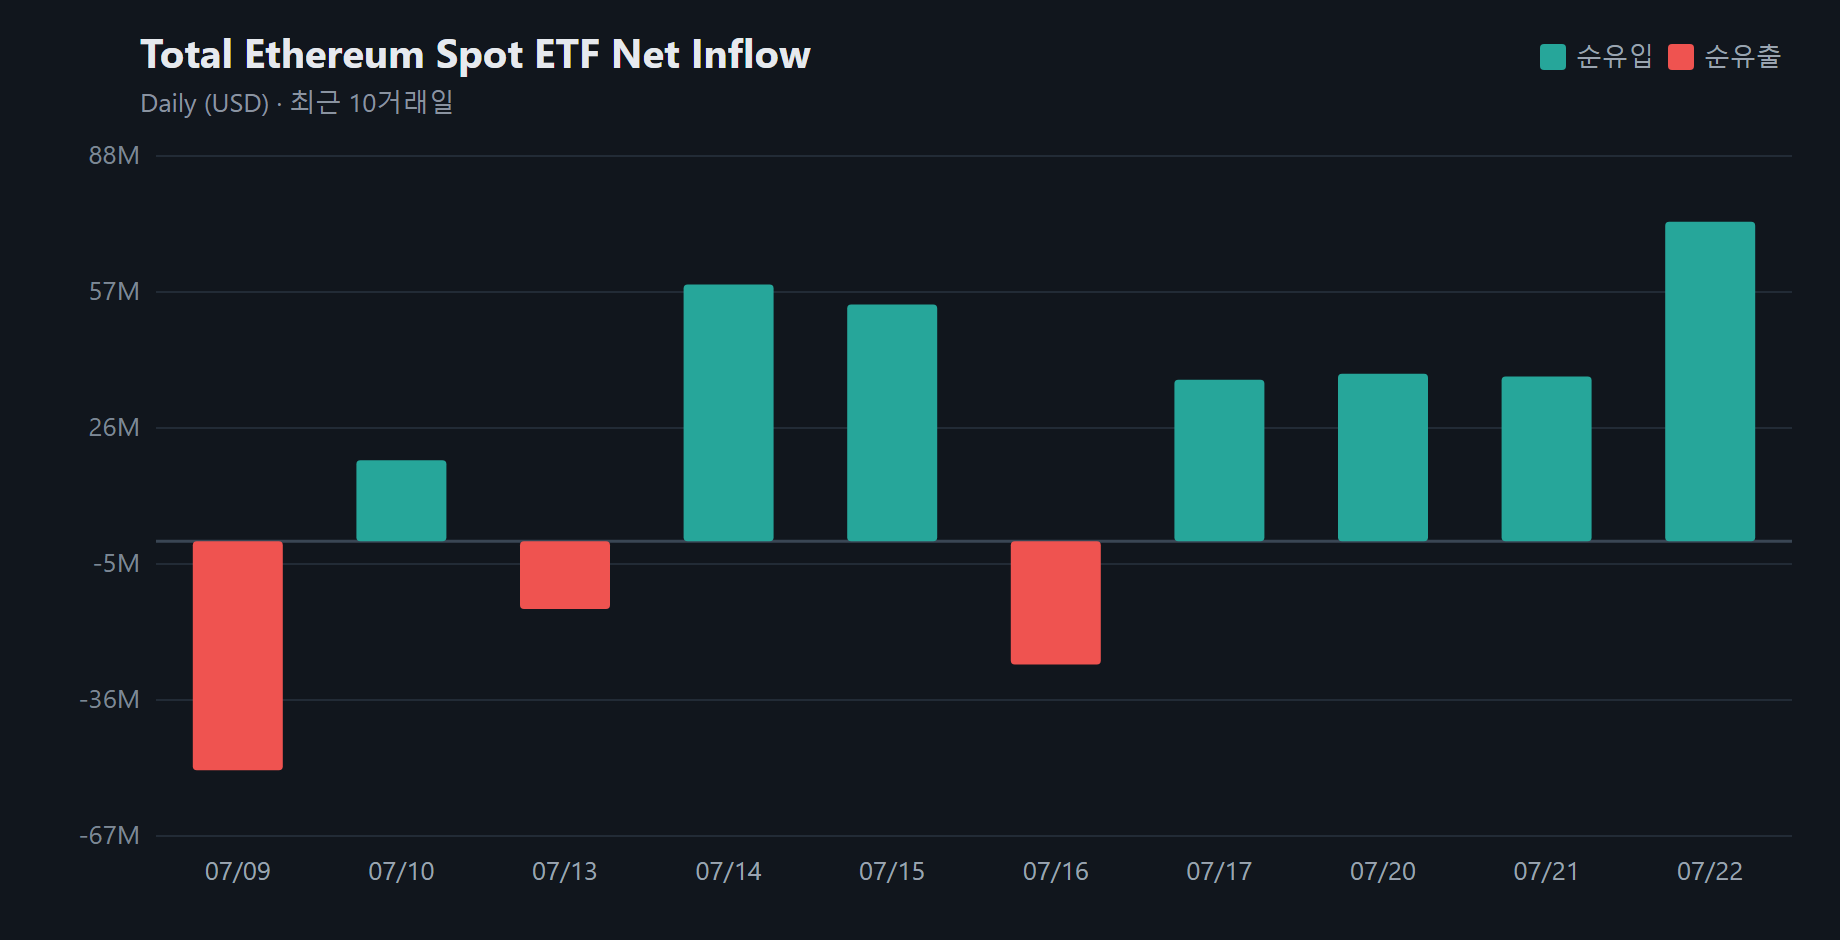
Still, the market’s institutional read-through is mixed. Solana spot ETFs have surpassed $1 billion in assets under management, and Goldman Sachs has been reported to hold a position worth about $108 million. Yet ETF inflows have slowed sharply—falling from roughly $419 million in November 2025 to about $34 million in April 2026, a decline of around 92%. The drop suggests that while 'network fundamentals' are improving, near-term 'risk appetite' has cooled, leaving institutions divided over timing.
For now, SOL’s narrow trading band reflects a market waiting for confirmation—either via a clean technical breakout, a clearer timeline toward Firedancer’s rollout, or signs that ETF inflows are stabilizing. The next decisive move, traders say, will likely depend as much on liquidity conditions and positioning as on Solana’s accelerating build-out.
🔎 Market Interpretation
- Price vs. fundamentals divergence: SOL is range-bound near $86 despite notable network upgrades and rising on-chain activity, creating a “wait-for-confirmation” market.
- Key range defines sentiment: Consolidation inside $77–$94 signals indecision; volatility is expected to expand as technical compression builds (Bollinger Band squeeze).
- Upside case depends on follow-through: A sustained break above $94 could shift momentum toward higher targets, but a brief spike is viewed as insufficient confirmation.
- Downside risk remains material: A breakdown below $77 risks a move toward $60, consistent with fragile sentiment in higher-beta altcoins.
- Positioning is supportive but dangerous: Whale/derivatives data showing ~69.3% long exposure can be bullish, yet it increases liquidation risk if price turns lower.
- Institutions are split on timing: Spot ETF AUM is above $1B, but inflows have dropped ~92% (Nov 2025 to Apr 2026), implying cooling risk appetite despite improving network narratives.
💡 Strategic Points
- Technical triggers to watch:
- Resistance: $88.10 (intermediate), then $94 (range top/breakout level).
- Support: $77 (range floor). A clean loss of this level raises odds of a deeper selloff.
- Volatility setup: Compressed Bollinger Bands on the 3-day chart suggests a larger move may be approaching.
- Scenario planning (price-led):
- Bull breakout: Above $94 with sustained volume could open a path toward $120 → $150 → $190 → $240 (contingent on trend continuation).
- Bear breakdown: Below $77 increases probability of a mean-reversion move toward $60.
- Scenario planning (fundamentals-led):
- Near-term catalyst: Clearer execution milestones for upgrades (especially Firedancer) could re-rate expectations.
- Adoption thesis: Claims of large quarterly economic activity and stablecoin throughput support a “payments/high-frequency” positioning.
- Institutional confirmation: ETF inflow stabilization is a key signal that macro liquidity and crypto risk appetite are turning supportive again.
- Risk management considerations:
- Liquidation sensitivity: Long-heavy positioning can accelerate drawdowns if $77 fails or if funding/leveraged longs unwind.
- Time horizon mismatch: Major throughput promises (Firedancer target release 2026) may not translate into immediate price strength.
- Narrative vs. verification: Treat ecosystem and tokenization concentration claims as directional indicators; confirm via independent on-chain/issuance data where possible.
📘 Glossary
- Bollinger Bands: A volatility indicator; “band compression” often precedes a larger price move (volatility expansion).
- Support / Resistance: Price levels where buying (support) or selling (resistance) pressure historically increases.
- Breakout / Breakdown: Price moving decisively above resistance (breakout) or below support (breakdown), often with increased volume.
- Derivatives positioning: The balance of long vs. short exposure in futures/perpetual markets; can hint at trader bias and liquidation risk.
- Whales: Large holders or traders whose positions can meaningfully influence market liquidity and volatility.
- TPS (Transactions Per Second): A throughput metric indicating how many transactions a blockchain can process per second.
- Finality: The point at which a transaction is considered irreversible; faster finality improves user experience and payment usability.
- Validator costs: Expenses to operate a network validator; lower costs can reduce participation barriers and potentially improve decentralization.
- Stablecoin volume: Transfer activity of price-pegged tokens (e.g., USD stablecoins), often used as a proxy for payments and trading settlement.
- Spot ETF AUM / inflows: Assets under management and net new capital entering ETFs; used to gauge institutional demand and risk appetite.
- High-beta altcoins: More volatile non-Bitcoin crypto assets that tend to move more sharply in risk-on/risk-off cycles.


Comment 0