 News
News  Coin Information
  About us
  Customer Service


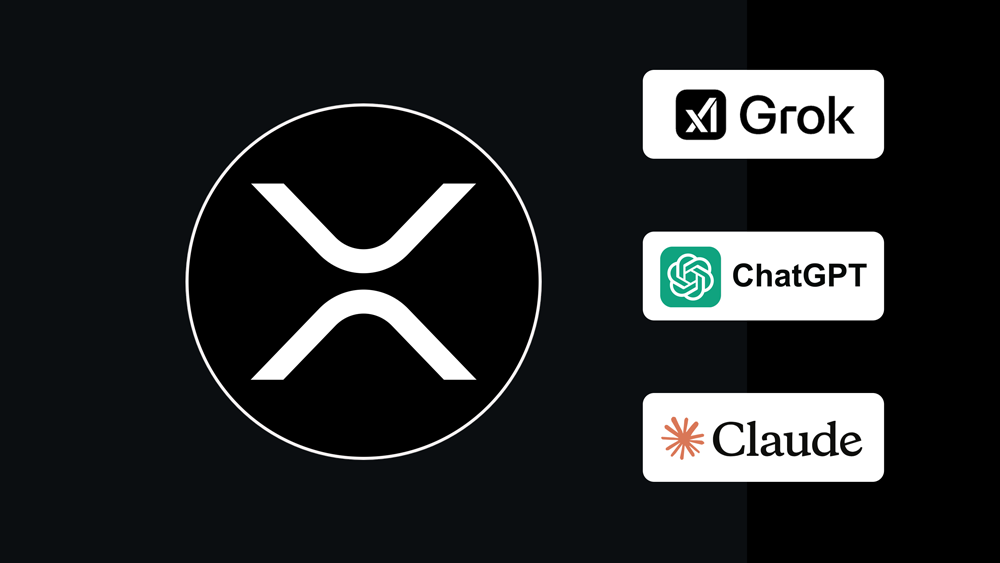
Ripple (XRP) is struggling to establish a clear direction as a short-term bounce repeatedly gives way to renewed selling pressure, keeping the token locked in a tight range despite the broader market’s search for momentum. While several leading AI models broadly agree XRP remains in a ‘bearish-leaning consolidation,’ they also leave room for a tradable rebound if key resistance levels break.
As of Saturday ET, XRP has traded sideways for roughly three weeks within a $1.33 to $1.49 band. Technical readings cited in the analysis show the relative strength index (RSI) hovering in the low-40s—near ‘neutral-to-weak’ territory and approaching oversold conditions—while price remains well below the 200-day moving average near $1.68. That gap has kept the medium-term structure tilted to the downside, even as buyers continue to defend support.
Market technicians often view repeated defenses of the same level as evidence of demand, and XRP’s $1.33 area has acted as a consistent floor. However, the rebound attempts have produced a series of ‘lower highs,’ a classic pattern indicating sellers are still controlling rallies. The report also notes that XRP is trading below key Fibonacci retracement zones, reinforcing the idea that overhead resistance remains heavy until the token can reclaim higher levels with conviction.
GPT-5.2 characterized the current setup as a ‘weakly bearish box-range correction,’ arguing that RSI staying below 50 implies selling pressure remains dominant and that rebound attempts have lacked meaningful volume support. In that framework, the model suggested the structure favors sellers below $1.48. It outlined a near-term path where a move above $1.42 could open a retest of $1.48, while a breakdown under $1.35 could increase the risk of a deeper slide toward $1.30.
Claude Sonnet 4.6 focused on what it described as a disconnect between trend and flow, pointing to XRP trading roughly 19% below its SMA200 as confirmation of a clear medium-term downtrend. At the same time, it interpreted the repeated holds near $1.335 and fading volume as a potential sign of ‘seller exhaustion,’ raising the possibility that a base could form around $1.36. Claude cautioned, however, that direction remains uncertain until XRP clears $1.390, and warned that losing $1.335 could expose the market to a drop toward $1.25.
xAI 4.1 took the most conservative stance, emphasizing that RSI has not regained upside momentum and that multiple consecutive down sessions point to persistent near-term pressure. It echoed the downside risk scenario, warning that a clean break of $1.33 could trigger a faster move toward $1.25. Still, it flagged a bullish alternative: if XRP pushes through $1.42, ‘short covering’ could accelerate a quick move into the $1.45 to $1.48 zone.
Put together, the models converge on an ‘unstable equilibrium’—a market that remains in a medium-term decline, but where short-term rebound potential persists because support has repeatedly held and momentum indicators sit near levels that can precede reflexive bounces. The analysis identifies $1.33 support and $1.42 resistance as the primary decision points likely to shape near-term price action.
Over the next 24 hours, the report frames three scenarios as most plausible: a break above the $1.39–$1.42 band that could extend a rebound toward $1.45–$1.48; a failure of $1.33 that could open a sharper move into the $1.25–$1.30 range; or continued range trading between $1.33 and $1.42 alongside shrinking volume, signaling indecision.
The models also attached probability-style estimates to their outlooks. GPT-5.2 placed an expected near-term high at $1.45–$1.48 and a low at $1.30–$1.33, with a 42% rebound probability. Claude Sonnet 4.6 projected a high around $1.415 and a low near $1.325, also assigning a 42% rebound probability. xAI 4.1 suggested a high near $1.44 and a low around $1.31, with a 38% rebound probability.
In broader terms, the setup underscores a market still trading beneath its long-term trendline, where any rally may be treated as corrective unless backed by stronger participation. RSI—commonly interpreted as oversold below 30 and overbought above 70—can hint at stretched conditions, while the 200-day moving average often serves as a dividing line between longer-term uptrends and downtrends. Fibonacci retracement levels, meanwhile, are widely used to map potential support and resistance zones.
Still, the report stresses that AI-driven forecasts remain probabilistic and can be quickly overwhelmed by macro conditions, liquidity shifts, and changes in market sentiment. With XRP pinned between well-defined levels, traders and investors are likely to continue watching for confirmation—particularly on volume—before concluding that the range has resolved into a sustained move.
🔎 Market Interpretation
- State of play: XRP is in a bearish-leaning consolidation, stuck in a tight $1.33–$1.49 range for ~3 weeks, with rebounds repeatedly sold.
- Trend vs range: Medium-term trend remains down because price is well below the 200-day moving average (~$1.68) and RSI sits in the low-40s (weak momentum).
- Support behavior: Repeated holds at $1.33–$1.335 suggest real demand and possible seller exhaustion, but the pattern of lower highs implies sellers still control rallies.
- Key decision levels: The market is effectively balanced between $1.33 support and $1.42 resistance; a break of either is likely to determine the next directional move.
- 24-hour scenario map:
- Upside: Break $1.39–$1.42 → rebound toward $1.45–$1.48 (potential acceleration via short covering).
- Downside: Lose $1.33 → faster slide into $1.25–$1.30.
- Neutral: Continue ranging $1.33–$1.42 with shrinking volume → ongoing indecision.
- Model consensus: All cited AI models describe an unstable equilibrium—downtrend intact, but bounce risk persists due to defended support and near-oversold-ish momentum.
- Probability estimates: Rebound odds cluster around 38%–42% (GPT-5.2: 42%, Claude: 42%, xAI: 38%).
💡 Strategic Points
- Primary trigger checklist:
- Bull trigger: A decisive reclaim of $1.39–$1.42 (ideally with stronger volume) increases odds of a push toward $1.45–$1.48.
- Bear trigger: A clean breakdown and acceptance below $1.33–$1.335 increases risk of a momentum move toward $1.25–$1.30.
- Range-trade logic (if conditions persist): As long as price remains between $1.33 and $1.42, expect mean-reversion behavior—buying support / selling resistance—until a breakout is confirmed.
- Confirmation emphasis: The article highlights volume as the key validator: breakouts without participation are more likely to fail back into the range.
- Resistance stack: Overhead pressure is reinforced by lower highs, being below the SMA200, and trading under important Fibonacci retracement zones—meaning rallies may remain corrective until higher levels are reclaimed.
- Risk framing: With tight boundaries, the market may appear calm, but range compression can precede abrupt moves—risk increases near range edges ($1.33 and $1.42).
- Model-specific levels to watch:
- GPT-5.2: Above $1.42 → retest $1.48; below $1.35 → risk toward $1.30.
- Claude: Needs clearance of $1.390 to improve directionality; loss of $1.335 risks $1.25.
- xAI: Break $1.42 could trigger short covering toward $1.45–$1.48; break $1.33 risks $1.25.
- Forecast caveat: Outputs are probabilistic and sensitive to macro, liquidity, and sentiment shifts; treat levels as decision points, not guarantees.
📘 Glossary
- RSI (Relative Strength Index): Momentum oscillator (0–100). Typically <30 oversold, >70 overbought. The article notes RSI in the low-40s, implying weak momentum.
- 200-day Moving Average (SMA200): Long-term trend gauge. Price below often signals a longer-term downtrend or bearish bias.
- Consolidation / Range: Sideways trading between defined support and resistance, often preceding a breakout or breakdown.
- Support: A price zone where buying interest tends to halt declines (here: $1.33–$1.335).
- Resistance: A price zone where selling pressure tends to cap rallies (here: $1.39–$1.42, then $1.45–$1.48).
- Lower Highs: Each rebound peaks lower than the previous one—commonly read as sellers controlling rallies.
- Fibonacci Retracement: Popular technical tool used to identify potential support/resistance zones after a move; trading below key retracements can imply heavier overhead resistance.
- Seller Exhaustion: A condition where selling pressure weakens after repeated pushes lower fail, sometimes preceding a base or rebound.
- Short Covering: Traders closing short positions by buying back the asset, which can accelerate upward moves after resistance breaks.


Comment 0