 News
News  Coin Information
  About us
  Customer Service


BTC/USD chart - Trading View
Exchange - Coinbase
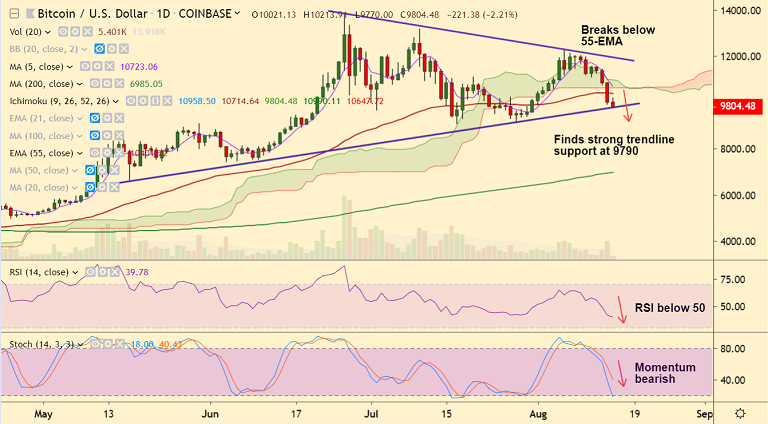
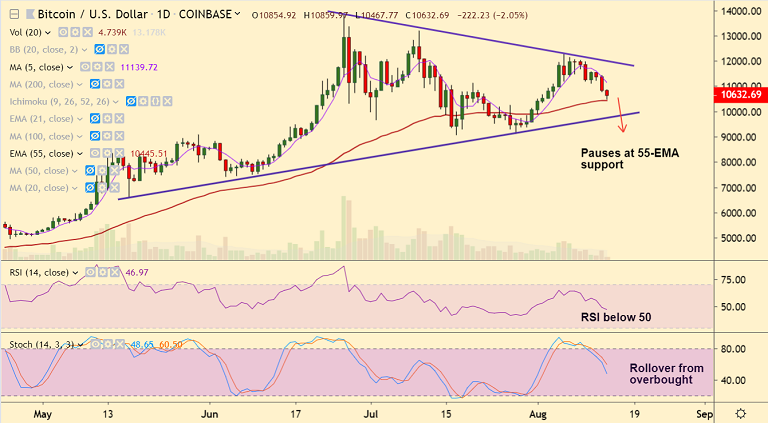
Support: 9790 (Trendline); Resistance: 10407 (55-EMA)
Technical Analysis: Bias Bearish
BTC/USD consolidates previous session's slump, trades 2.20% lower at 9800 at 04:00 GMT.
The pair is extending weakness below daily cloud, hits news August month lows.
Technical indicators are bearish, scope for further downside. Stochs ans RSI are sharply lower and RSI is well below 50 level.
MACD shows bearish crossover on signal line and -ve DMI crossover on +ve DMI adds to the bearish bias.
Strong trendline support seen at 9790. Break below will see further downside. Next major support aligns at 100-DMA at 9656 ahead of 110-EMA at 9313.
Oscillators on the intraday charts are in oversold territory. Scope for minor pullbacks.
Retrace above 55-EMA (10407) will see consolidation. Break above 21-EMA (10824) negates near-term bearishness.


Comment 0