
 Add as a preferred source on Google
WTI jumps 7.3% in a week as risk-asset environment scores 45
WTI crude rose 7.3% over the week as volatility and elevated rates weighed on markets. Liquidity and M2 growth offset some pressure, leaving the risk-asset environment at a neutral score of 45.


Oil prices rose sharply over the past week, while U.S. Treasury yields and market volatility remained elevated. Growth in the U.S. money supply and Federal Reserve liquidity provided support, leaving the overall risk-asset environment neutral rather than tilted decisively in either direction.
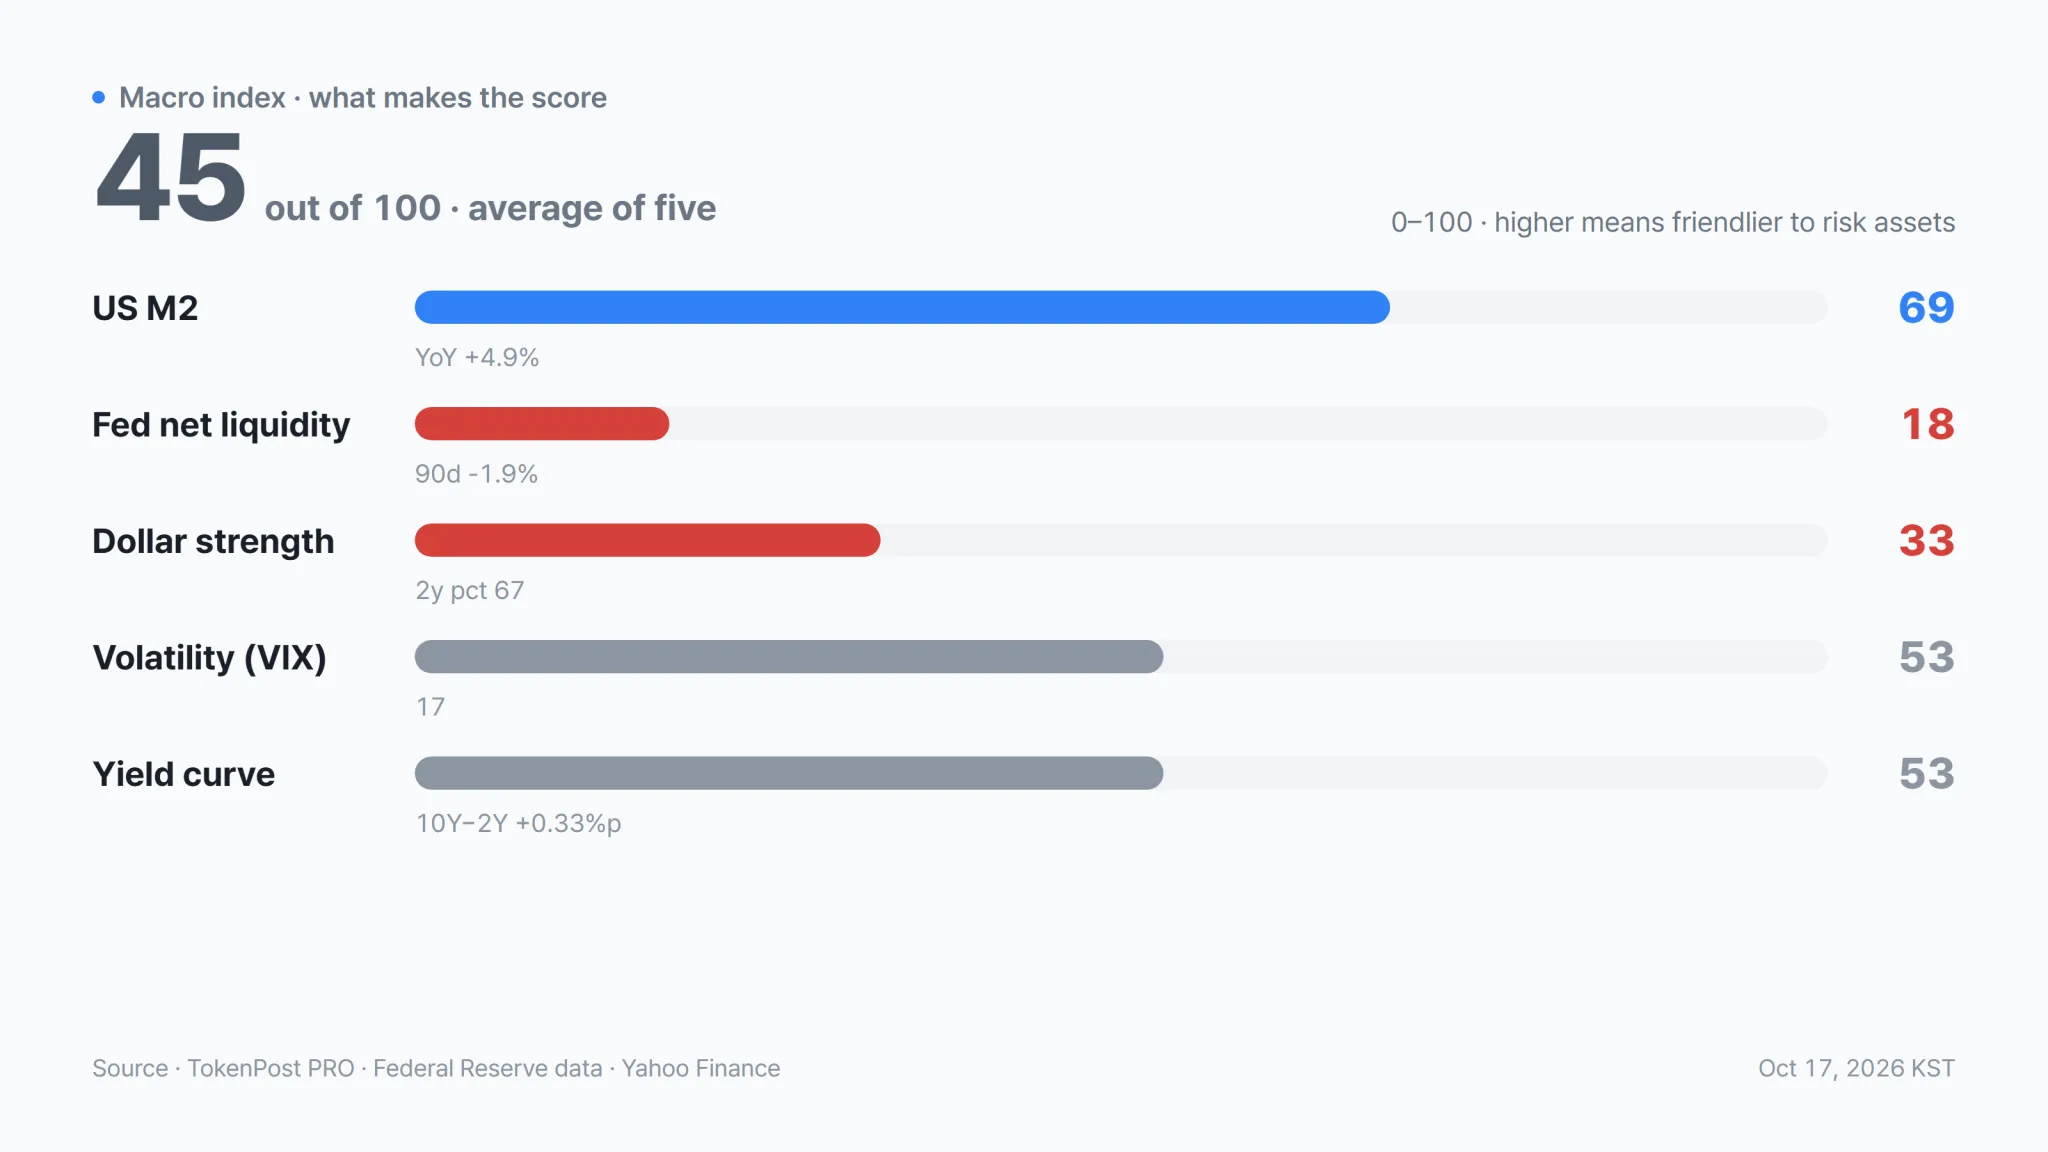
As of Oct. 16, the TokenPost PRO Macro Index stood at 45 out of 100, indicating a neutral environment. The index averages scores for U.S. M2, Fed net liquidity, dollar strength, market volatility and the yield curve, with higher readings signaling more favorable conditions for risk assets. It fell 8 points from 53 on Oct. 9.
Fed liquidity and the U.S. money supply supported the index this week, while volatility and interest rates remained headwinds. WTI crude climbed 7.3% and Brent rose 0.4% over the week, emerging as variables that could affect inflation and the path of interest rates.
Liquidity offsets volatility and rate pressure
The 10-year U.S. Treasury yield was 5.19%, down 0.05 percentage point from 5.24% a week earlier. The two-year yield was little changed at 4.82%, compared with 4.80%. The 10-year minus two-year spread narrowed to 0.37 percentage point from 0.44 percentage point. The yield-curve component scored 53.
Yields also remained high over longer periods. Compared with a month earlier, the two-year yield was 0.08 percentage point higher and the 10-year yield was 0.18 percentage point higher. Against year-earlier levels of 3.41% and 3.99%, respectively, the two-year yield was up 1.41 percentage points and the 10-year yield was up 1.20 percentage points.
The 10-year real yield, which adjusts for inflation, was 2.84% as of Oct. 14, down 0.08 percentage point from 2.92% a week earlier but 1.11 percentage points above 1.73% a year earlier. Lower real yields can reduce the opportunity cost of holding non-yielding assets such as bitcoin and gold.
The U.S. Dollar Index fell 0.4% over the week to 101.82 from 102.21. It was 1.5% above 100.31 a month earlier and 3.5% higher than 98.39 a year earlier. The dollar component, which treats a weaker currency as more supportive of risk assets, scored 33.
The VIX volatility index rose 13.7% to 16.87 from 14.84 a week earlier and was near its month-earlier level of 17.71. It stood around the midpoint of its two-year range. The volatility component, where lower readings are considered more favorable, scored 53.
Fed net liquidity stood at $5.87 trillion as of Oct. 14, up $7.1 billion, or 0.1%, from a week earlier. The increase largely reflected an $8.1 billion rise in Fed assets to $6.76 trillion from $6.75 trillion. The Treasury General Account held $883.37 billion, while reverse-repo balances stood at $201 million. Net liquidity was down 1.9% from $5.99 trillion 90 days earlier, giving the component a score of 18.
U.S. M2 totaled $23.34 trillion in August 2026, up 5.7% from $22.09 trillion a year earlier and 0.5% from $23.22 trillion a month earlier. The seasonally adjusted measure is released monthly by the Fed. Its score of 69 was the most favorable among the index’s five components.
Oil surge adds a new variable
The week’s largest move came in oil. As of Oct. 14, WTI crude traded at $101.91 a barrel, up 7.3% from $95.02 a week earlier, while Brent was little changed at $126.55 from $126.
The year-over-year increases were larger, with WTI up 71.2% and Brent 100.9%. A sustained rise in oil prices could add to inflation pressure and affect the interest-rate path, creating another variable for risk-asset investors.
The Nasdaq Composite closed at 26,713.03 on Oct. 15, down 1.8% over the week. Bitcoin fell 0.4% over the past seven days to trade at $82,233.
[Editor’s note] The TokenPost PRO Macro Index averages five indicators converted into scores from 0 to 100: year-over-year M2 growth, the 90-day change in Fed net liquidity, dollar strength, market volatility and the yield-curve spread. Dollar strength and volatility are scored by their relative positions within their two-year ranges. Higher scores indicate conditions more favorable to risk assets, including bitcoin and other cryptocurrencies.
John Kim
John Kim reports on the digital-asset business for TokenPost. Send corrections or tips to info@tokenpost.com.