
 Add as a preferred source on Google
[BTC cycle tracker] Bitcoin tests $81,900 support as $82,000 resistance comes into focus
Bitcoin at $81,900 is testing overlapping weekly and daily support. Weekly resistance peaks at $82,000, while its drawdown from the all-time high has widened to 35.02%.


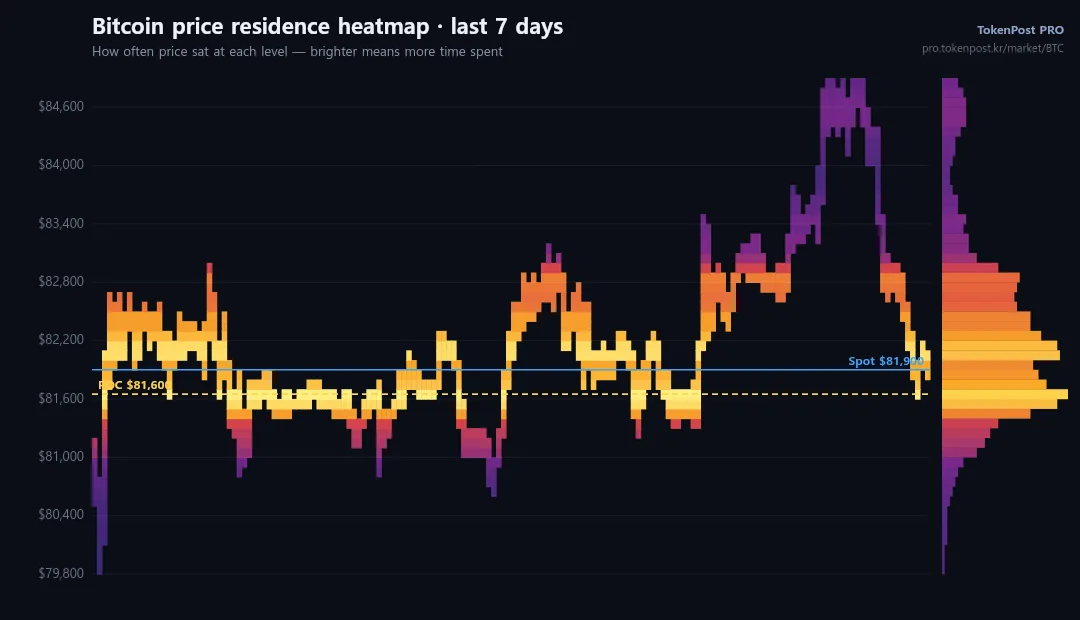
Bitcoin is trading above its weekly point of control while testing support at $81,900. The weekly resistance peak at $82,000 is the immediate level in focus for a sustained rebound.
At $81,900, bitcoin sits at the boundary between its weekly support and resistance zones. Holding this level and clearing the concentration of trading activity overhead are the main tests for the recovery.
■ Weekly heatmap
As of October 22, the weekly price heatmap places the strongest point of control (POC) near $81,600. This marks the price with the greatest concentration of trading activity over the past week.
Bitcoin’s current price of $81,900 is slightly above that concentration. The weekly trading range is $79,800–$84,900, with the POC providing a reference for assessing its position within the range.
The weekly resistance zone spans $81,900–$82,900. Activity peaks near $82,000, making that level the immediate resistance reference.
Below the current price, the weekly support zone extends from $81,400 to $81,900, with activity concentrated most heavily at $81,600. Price stability within this band would be consistent with support holding.
■ 24-hour heatmap
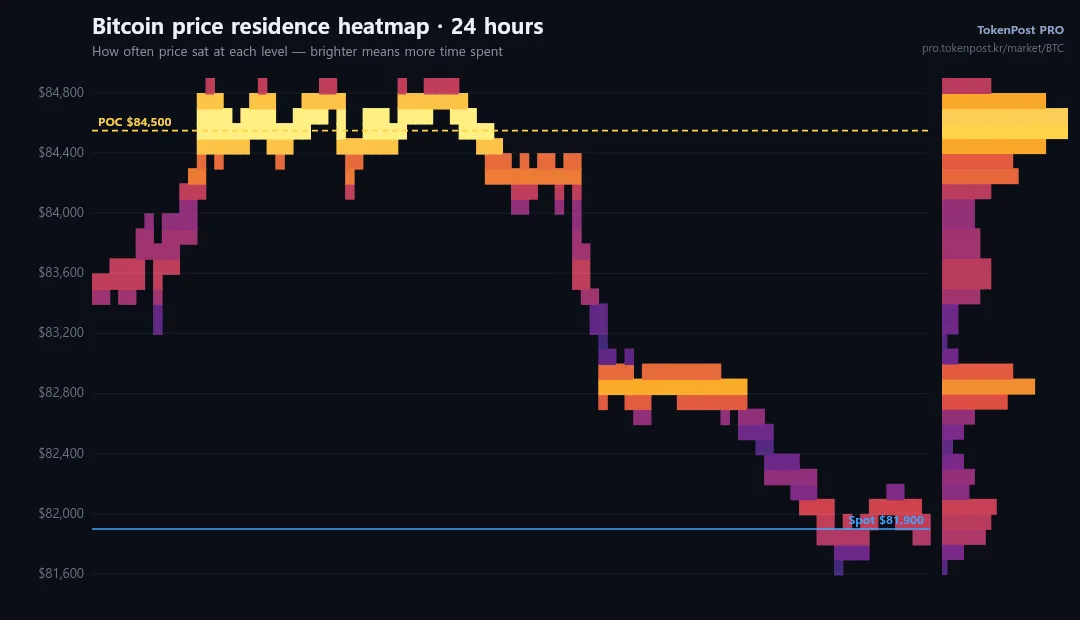
On the 24-hour heatmap, the strongest POC is near $84,500. This is the largest concentration of trading activity over the period.
Bitcoin at $81,900 remains below that POC and near the lower end of its $81,600–$84,900 daily range. The daily concentration therefore sits well above the current market price.
The daily resistance zone runs from $84,200 to $84,800, with its peak at $84,500. This band marks the main overhead concentration on the 24-hour view.
Daily support is concentrated between $81,700 and $81,900, peaking at $81,800. The current price is at the upper edge of this support band.
Drawdown from the high Bitcoin at $81,900 is 35.02% below its all-time high of $126,038, recorded on October 6, 2025. The drawdown has widened slightly from 34.75% a week earlier.
Performance since the halving After 915 days since the halving, bitcoin is up 28.27% from its halving-day price of $63,850. It continues to trade above that reference level.
Performance since the cycle low After 1,431 days since the cycle low of $15,770, bitcoin is up approximately 419%. Despite the drawdown from its high, the price remains substantially above the cycle low.
Riza Dagoc
Riza Dagoc reports on regulation, investing and the digital-asset business for TokenPost. Send corrections or tips to info@tokenpost.com.