
 Add as a preferred source on Google
Volume Can Help Test Bull and Bear Flags, But Many Breakouts Fail
In historical bull-market results, 44% of upward breakouts and 45% of downward breakouts failed to reach 5%. Rising volume can support a setup but cannot confirm it.



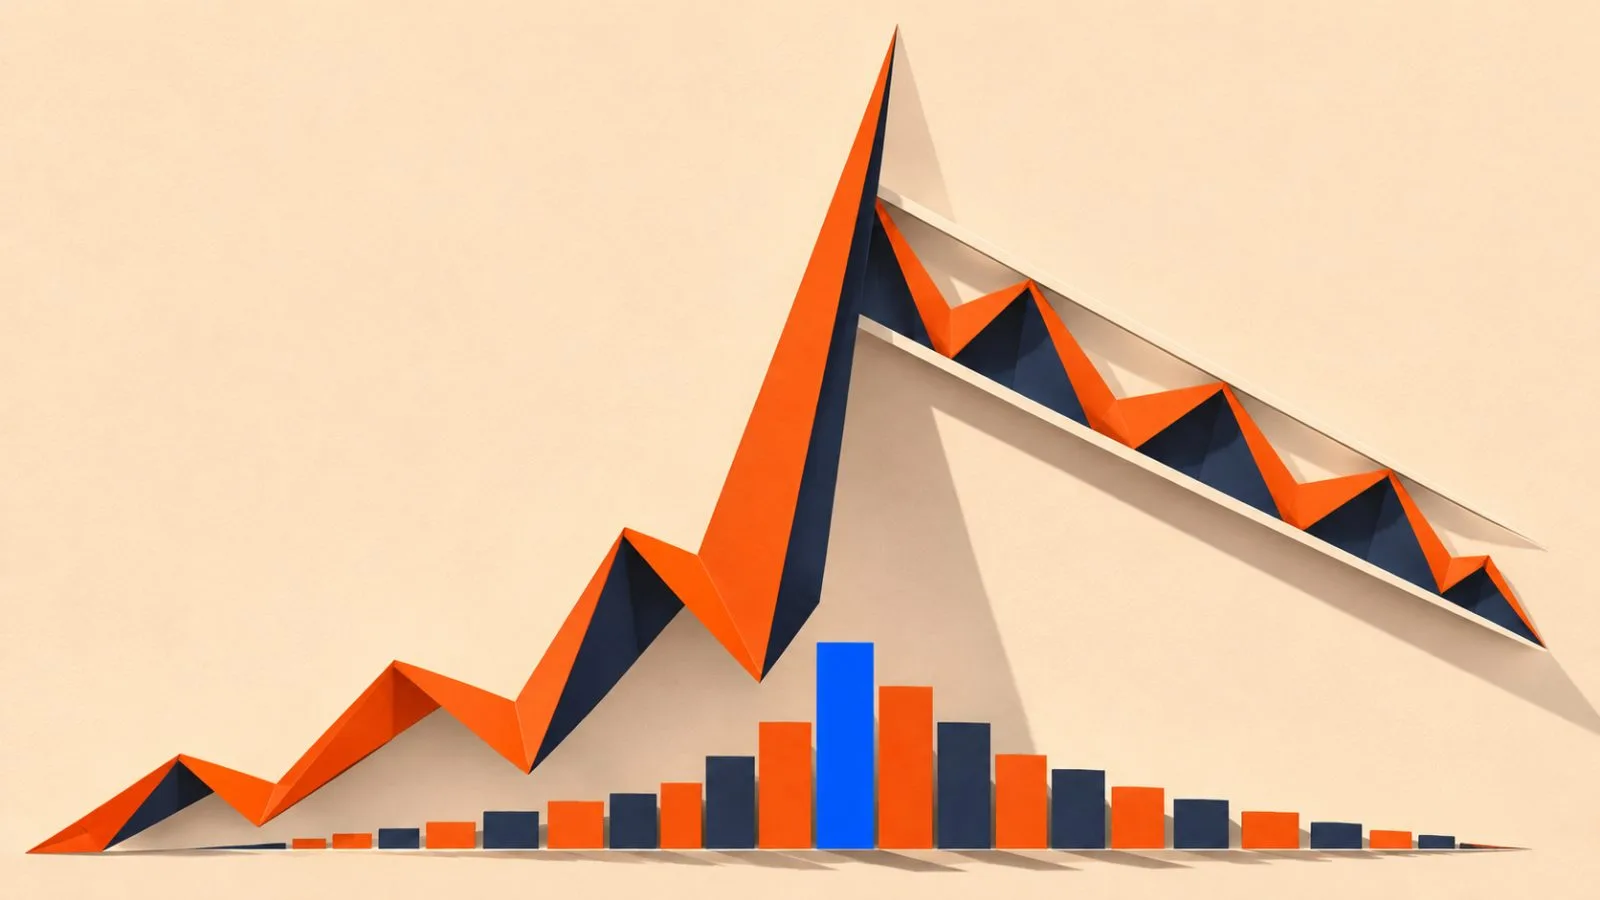
A volume check can help crypto traders assess whether a bull or bear flag has volume support, but historical stock results show many breakouts failed to reach 5%.
What makes a flag
A flag forms when a sharp price move is followed by a brief pause in a channel that slopes against the initial move. The sharp move is the pole; the channel marks the consolidation that follows it.
A bull flag follows an advance and slopes lower. A bear flag follows a decline and slopes higher. In either case, the pause moves against the earlier trend, giving the pattern its flag-like shape.
The setup is easier to identify when the pole is distinct and the pause stays within parallel or nearly parallel boundaries. A gradual move or choppy range provides less definition: without a clear sharp move, there is no obvious pole for the consolidation to interrupt.
A move above the channel in a bull flag, or below it in a bear flag, can signal a possible continuation of the prior move. The boundary break is a signal to assess, not confirmation that the trend will continue.
How volume fits
The common volume sequence has three stages: activity rises during the pole, eases during the pause and picks up again as price breaks the channel. That pattern can add support to a continuation reading, but it cannot ensure the breakout will hold.
The comparison is between the pole, the flag and the boundary break on the same chart. A bull flag pairs an advance with a generally lower-volume, downward-sloping pause; a bear flag pairs a decline with an upward-sloping recovery. A volume increase at the break lends more support to the signal under the standard charting framework.
Lower volume during the pause is common in the historical cases, but it is not universal. Flag-period volume fell in 74% of upward-breakout cases and 77% of downward-breakout cases. Unusual volume by itself is not a reason to discard a flag, while a boundary break without increased volume offers less confirmation.
That distinction keeps volume in its proper role: it is one part of evaluating the pattern. The channel’s direction and the sharpness of the initial move describe the setup; the volume sequence adds context to whether the breakout fits the usual pattern. Neither can establish the outcome in advance.
What the historical figures show
Historical stock-chart results updated Aug. 27, 2020, showed that 44% of upward breakouts in the bull-market results failed to rise at least 5%. In the same bull-market results, 45% of downward breakouts failed to fall at least 5%. Average moves were 9% after upward breaks and 8% after downward breaks.
The failure rates and averages describe different parts of those results. The failure figures count cases that did not reach the 5% threshold in the breakout direction; the averages describe the moves recorded after the breaks. Neither figure tells how a particular flag will perform.
The volume percentages describe how often activity trended lower during the flag in the historical cases. They do not say that a breakout with declining volume will fail, or that rising volume guarantees a successful continuation. The figures provide context for the pattern rather than a pass-or-fail rule.
The performance data come from stock charts, not a crypto-specific sample, and measure short-term price swings. They do not establish a comparable success rate for Bitcoin, Ether or other digital assets. Applying the stock results directly to crypto would go beyond what the data show.
The 5% mark is a research cutoff, not a trader’s realized break-even after fees, slippage and other costs. Those costs are not reflected in the threshold. The historical figures therefore describe price movement in the sample, not net returns after an individual trade’s expenses.
Enna Lee
ReporterEnna Lee reports on investing and digital-asset markets for TokenPost. Send corrections or tips to info@tokenpost.com.