 News
News  Coin Information
  About us
  Customer Service


Wealthy crypto investors are continuing to cluster around 'major' assets—led by Bitcoin (BTC) and Ethereum (ETH)—even as a separate set of smaller tokens flashes 'extreme oversold' signals on the Relative Strength Index (RSI), raising fresh debate over whether sharp declines reflect capitulation or merely a pause before further downside.
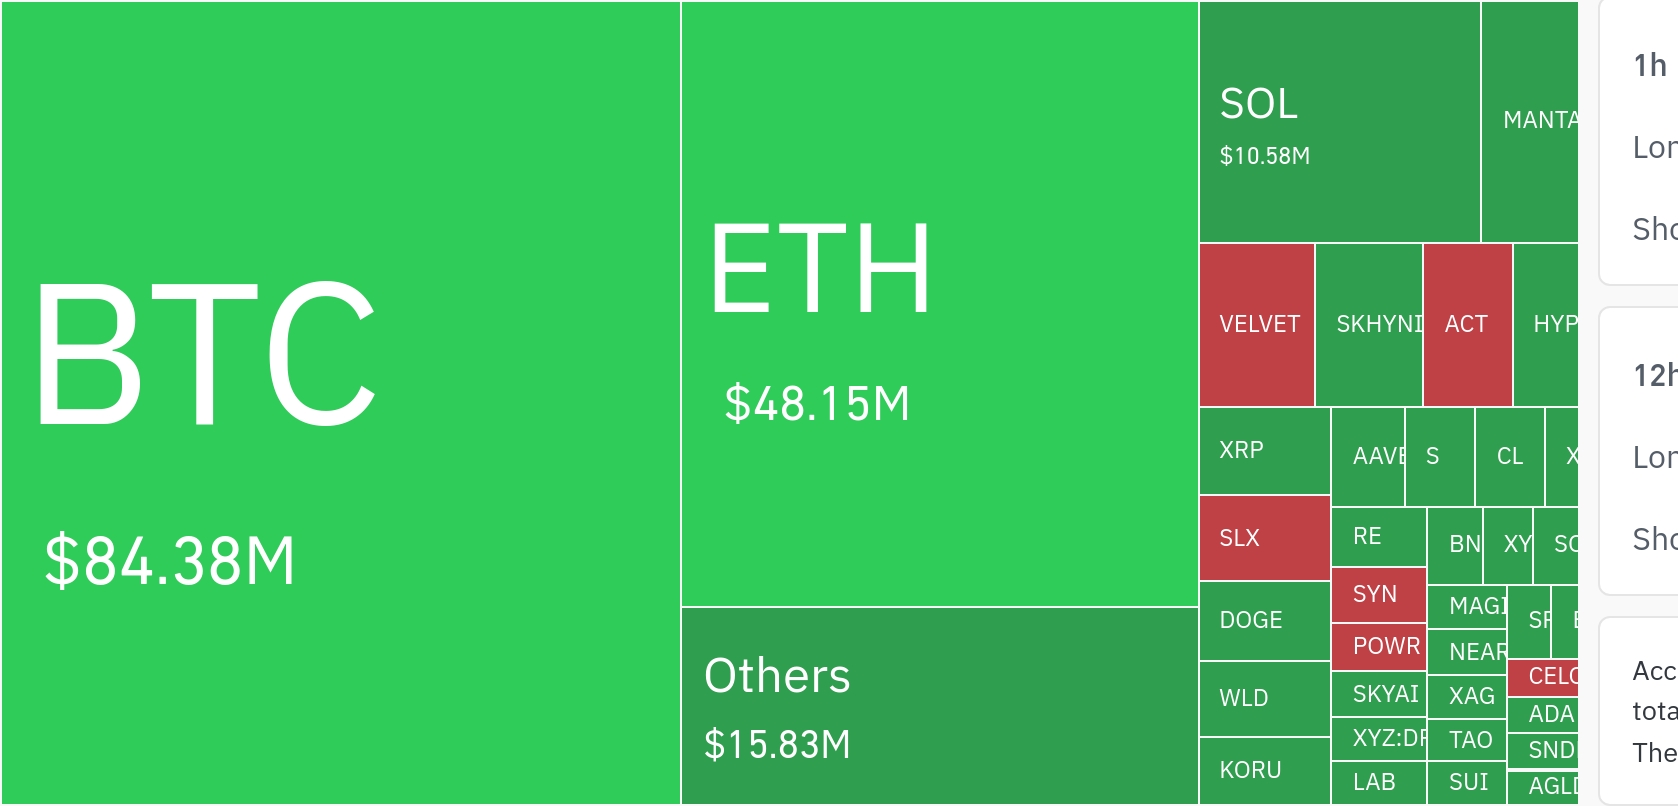
According to a portfolio and buying-trend snapshot compiled from Tuesday UTC data, Bitcoin (BTC) ranked first among high-net-worth holders and buyers, appearing in 82% of observed portfolios. Ethereum (ETH) followed at 79%, while XRP (XRP) placed third at 69%. Solana (SOL) ranked fourth at 47%, and Ethereum Classic (ETC) rounded out the top five at 35%.
The concentration in large-cap tokens suggests a defensive posture amid persistent market uncertainty. In practice, this kind of positioning often reflects a preference for deeper liquidity, tighter spreads, and broader global adoption—features that can be especially attractive during volatile periods when smaller assets tend to experience larger drawdowns and thinner order books.
At the same time, technical indicators pointed to pockets of intense selling pressure in select altcoins. As of 12:00 UTC, several Korea-listed pairs posted RSI readings in the 0–5 range, far below the level typically interpreted as oversold. RSS3 (RSS3) registered an RSI of 0.93 alongside a daily move of -5.01%. Contentos (COS) printed an RSI of 1.37 with a -0.51% change, while IOTA (IOTA) showed an RSI of 1.84 and a -1.06% move. Kratos (CRTS) posted an RSI of 3.86 (-2.60%), and Mayflower (MAY) stood at 5.30 (-2.41%).
RSI, or the Relative Strength Index, compares the magnitude of recent gains versus losses over a set period to gauge momentum. In standard technical analysis, an RSI below 30 is often labeled 'oversold', and readings near zero are widely considered 'extreme'—typically signaling heavy, persistent selling. However, traders caution that RSI can remain depressed for extended periods during strong downtrends, making it a timing tool best used alongside price structure, volume, broader risk sentiment, and token-specific liquidity conditions.
Overall, the data highlights a market split: affluent investors are gravitating toward established, high-liquidity names, while segments of the altcoin market are showing stress that could either precede a mean-reversion bounce or reflect continued risk-off positioning. The divergence underscores how capital tends to concentrate in perceived 'safer' crypto assets when downside volatility resurfaces across smaller tokens.
🔎 Market Interpretation
- Large-cap concentration signals defense: High-net-worth crypto holders are predominantly positioned in BTC (82% of portfolios) and ETH (79%), indicating a preference for liquidity and perceived safety during uncertainty.
- Divergence between majors and smaller tokens: While capital clusters into established assets, several smaller Korea-listed altcoins show extreme RSI oversold readings (near 0–5), reflecting intense selling pressure.
- “Extreme oversold” is not an automatic bottom: RSI can stay depressed in sustained downtrends, so these readings may represent capitulation or a continuation of risk-off behavior rather than an immediate rebound signal.
- Risk-off market regime: The split highlights a classic behavior in volatile markets—investors rotate to deeper-liquidity names as thinly traded tokens face steeper drawdowns and weaker order-book support.
💡 Strategic Points
- Prioritize liquidity when volatility rises: The portfolio ranking (BTC, ETH, XRP, SOL, ETC) suggests wealthy investors value tighter spreads, deeper order books, and broader adoption when downside risk increases.
- Use RSI as a condition, not a trigger: Readings below 30 indicate “oversold,” but 0–5 implies extreme selling; confirmation should include price structure (support/base formation), volume shifts, and broader market sentiment.
- Differentiate mean reversion vs. trend continuation: Extreme RSI in tokens like RSS3 (0.93), COS (1.37), IOTA (1.84), CRTS (3.86), and MAY (5.30) could set up sharp bounces—yet persistent downtrends can keep RSI pinned low.
- Account for token-specific microstructure: Thin liquidity and localized exchange flows (e.g., Korea-listed pairs) can amplify RSI extremes; consider slippage, order-book depth, and event/news catalysts before sizing trades.
- Portfolio implication: The observed behavior supports a barbell approach some investors use in stress periods—core exposure in majors, with cautious/limited allocation to distressed alts only when additional confirmation appears.
📘 Glossary
- RSI (Relative Strength Index): A momentum oscillator comparing recent gains vs. losses over a set period; commonly interpreted as oversold below 30 and overbought above 70.
- Extreme oversold: Informal term for very low RSI (near 0–5), typically indicating persistent, heavy selling pressure.
- Large-cap / majors: Higher-market-cap, widely adopted cryptocurrencies (e.g., BTC, ETH) that generally offer better liquidity and tighter spreads.
- Liquidity: How easily an asset can be bought/sold without materially moving the price; higher liquidity usually reduces slippage and execution risk.
- Spreads: The difference between bid and ask prices; tighter spreads often indicate more efficient markets.
- Capitulation: A phase where selling becomes intense and widespread, sometimes occurring near market bottoms but not guaranteed.
- Mean reversion: The tendency for price to move back toward its average after extreme deviations; more likely when selling pressure fades and buyers return.
- Risk-off: Market environment where participants reduce exposure to higher-risk assets, favoring perceived safer or more liquid holdings.


Comment 0