 News
News  Coin Information
  About us
  Customer Service


Solana (SOL) extended its weekly advance to hold above the $86 level, a move that traders are watching for clues on whether the token is emerging from its recent pullback as broader crypto market liquidity improves.
As of Sunday, April 19 at 2:59 p.m. ET, SOL traded at $86.06, up 1.13% over the past 24 hours. On a seven-day basis, the token was up 3.37%, signaling a shift in near-term momentum after a softer month.
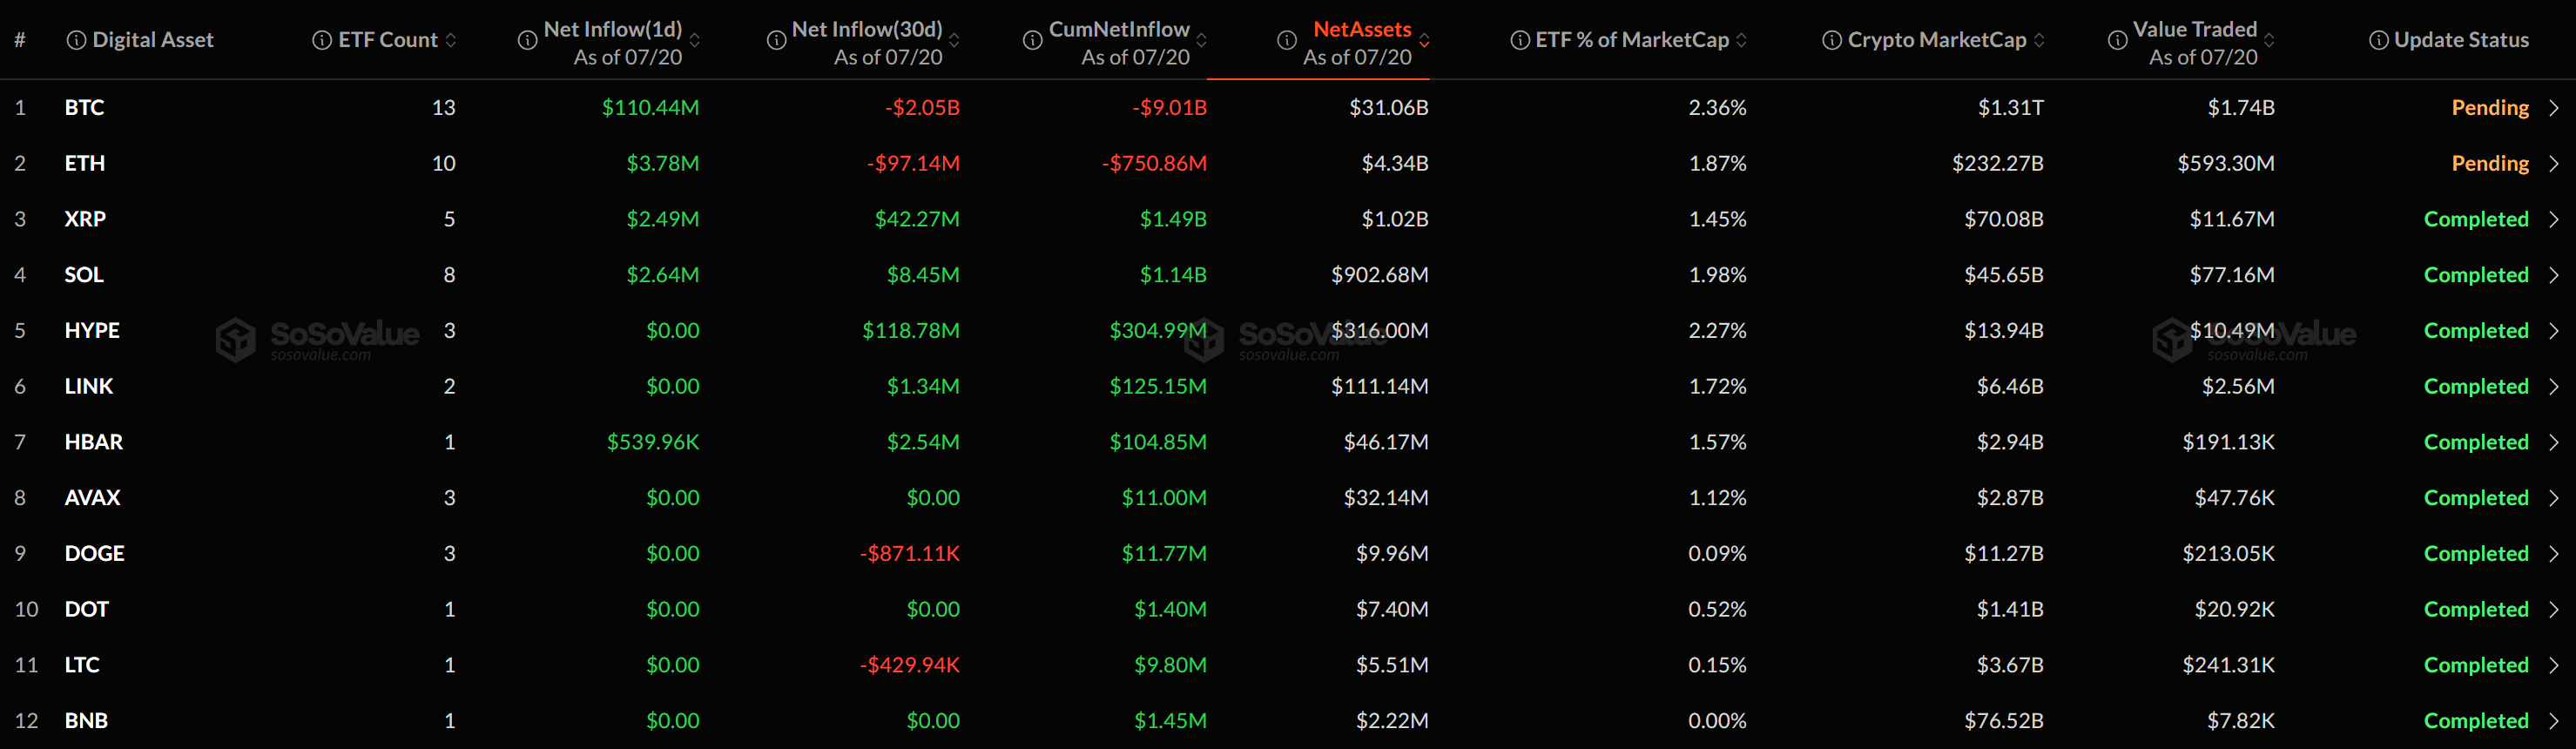
Solana remains the No. 7 cryptocurrency by market capitalization, with a market cap of roughly $49.5 billion—about 1.93% of the total digital asset market, according to figures cited in the report. Trading activity also picked up: 24-hour volume rose to more than $4.7 billion, a 20.72% increase from the prior day, in a sign of renewed participation.
The price action comes after SOL posted a 4.12% decline over the past 30 days, reflecting a broader period of consolidation across large-cap altcoins. However, short-term indicators in the report pointed to a rebound attempt, with SOL gaining 0.40% in the last hour at the time of measurement—suggesting buyers are defending the mid-$80s region.
Token supply dynamics remain a structural feature for longer-horizon investors. Solana operates an inflationary issuance model with no fixed maximum supply. Circulating supply was estimated at about 575.5 million SOL, versus a total issued amount of roughly 624.8 million. The report also referenced a self-reported circulating figure of about 525.2 million SOL, implying an alternative market-cap estimate near $45.2 billion. Its fully diluted valuation (FDV)—a metric that estimates value if all coins were in circulation—was pegged at approximately $53.7 billion.
Market microstructure data underscored where liquidity is concentrated. The report estimated that centralized exchanges accounted for nearly all of Solana’s daily turnover, with about $4.7 billion in CEX volume versus roughly $38,000 on decentralized exchanges. While DEX volume can vary widely by data source and venue coverage, the imbalance suggests that SOL’s near-term price discovery remains heavily driven by centralized order books.
On a medium-term view, SOL was up 5.11% over the past 60 days, indicating a comparatively stable climb despite lingering weakness earlier in the year. Over 90 days, however, it was still down 32.24%, highlighting how sharp the previous drawdown was and why traders are treating the current rally as a potential recovery leg rather than a confirmed trend reversal.
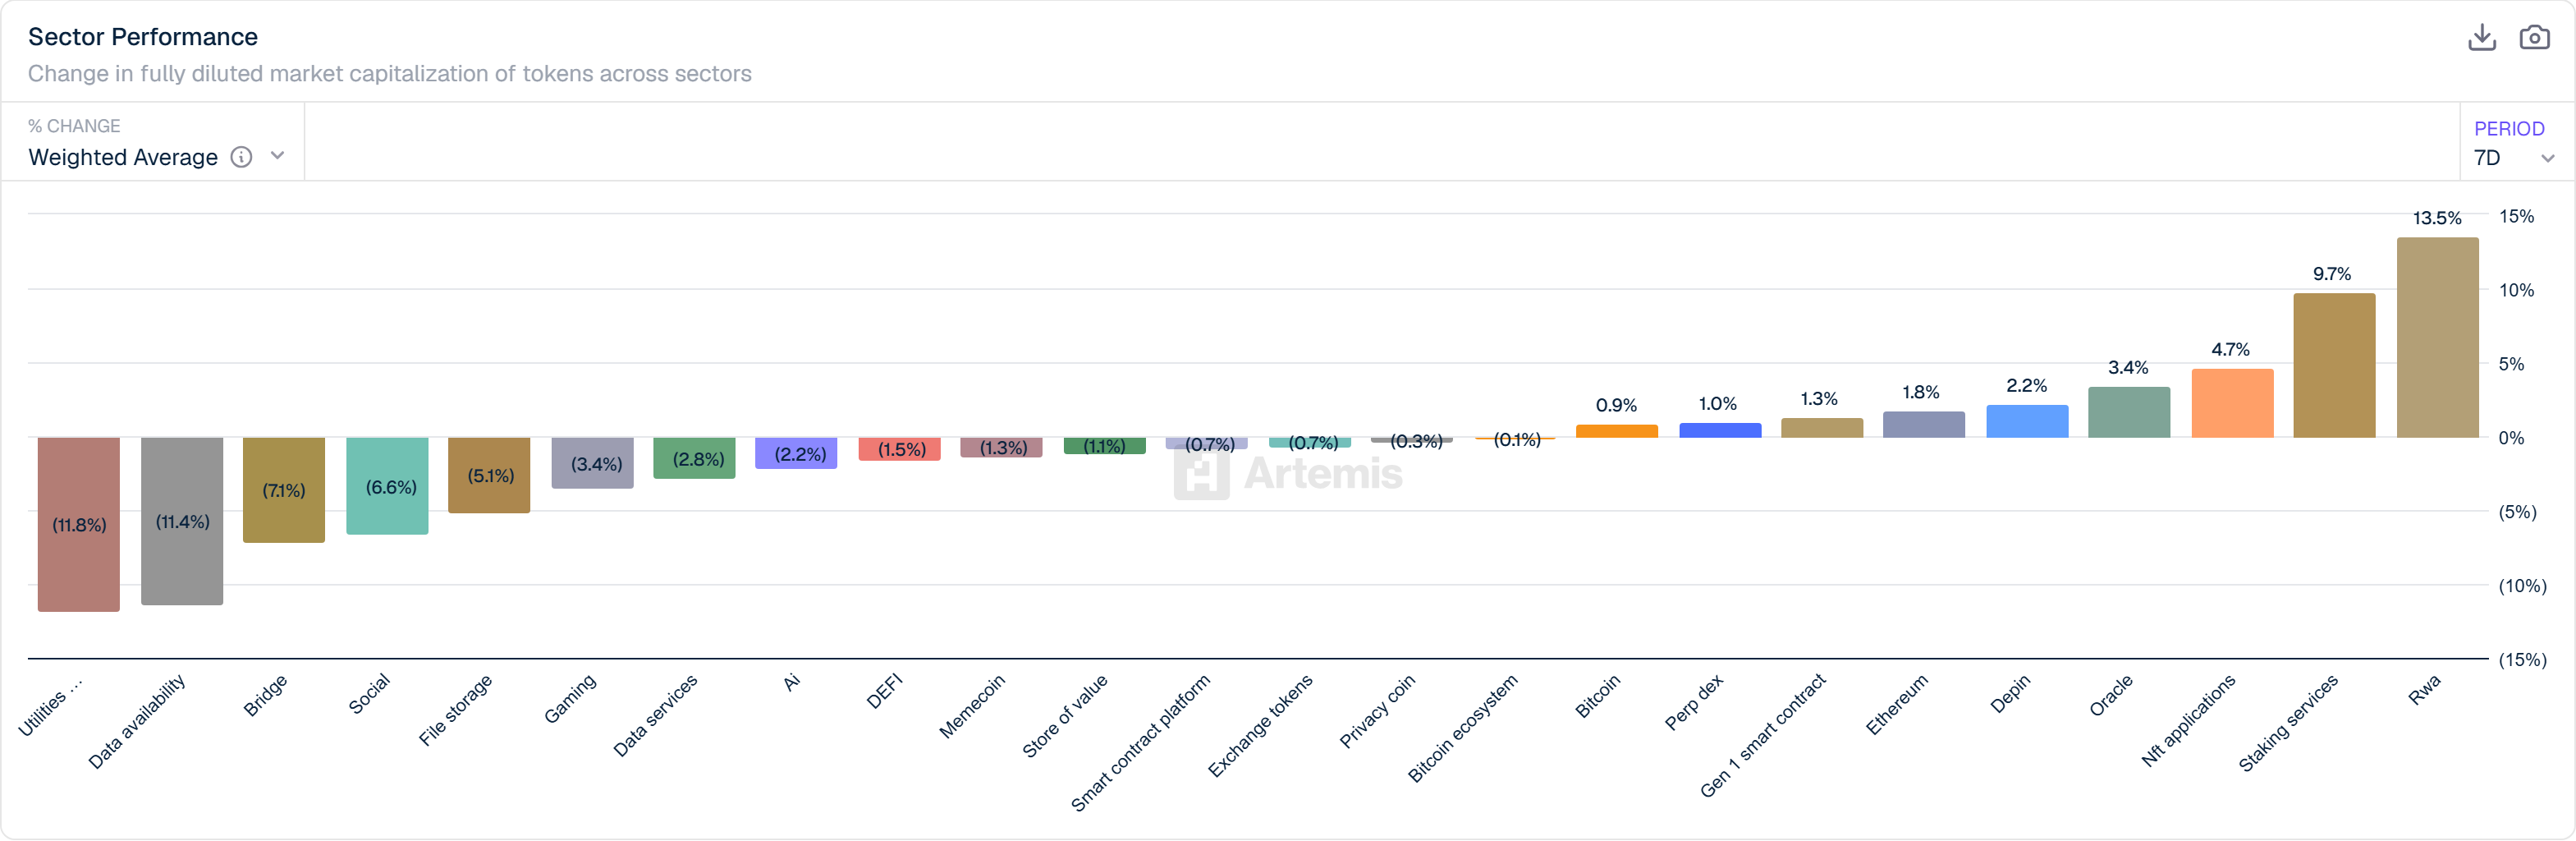
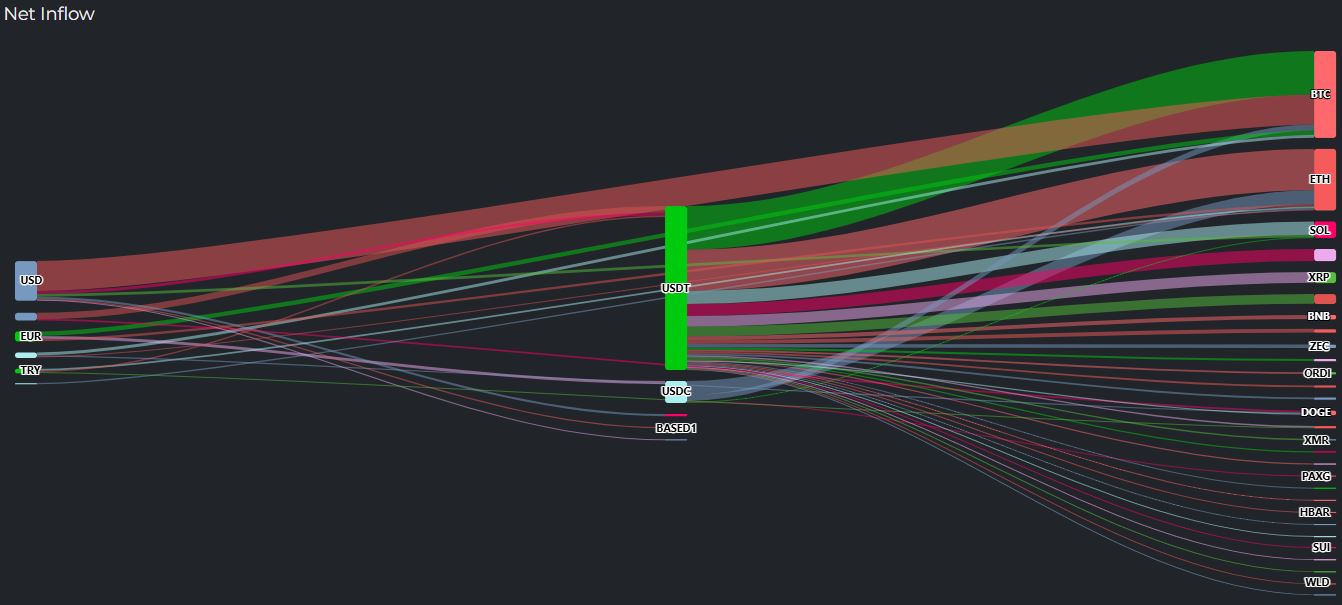
Solana’s fundamental pitch has remained consistent: high throughput and comparatively low fees, positioning it as an alternative smart-contract platform to Ethereum (ETH). The network continues to host applications across DeFi, NFTs and gaming—segments that tend to be sensitive to shifts in 'liquidity inflow' and risk appetite.
Analysts cited in the report said SOL may trade in a near-term range between $80 and $90, with the $90 level framed as a key resistance zone. A decisive break above that threshold could attract incremental momentum flows, while the recent surge in trading volume points to the potential for higher volatility if speculative interest continues to build.
Looking ahead, Solana’s next move is expected to remain closely tied to the direction of Bitcoin (BTC) and Ethereum (ETH), as well as broader market sentiment. With volume rising sharply day over day, traders will be watching whether liquidity stays elevated—an environment that can amplify both breakouts and pullbacks.
🔎 Market Interpretation
- Price stabilizing above a key level: SOL held above $86, suggesting buyers are defending the mid-$80s after a recent pullback.
- Momentum improving short term: SOL was up +1.13% (24H) and +3.37% (7D), contrasting with a still-negative -4.12% (30D) that signals consolidation rather than a fully renewed uptrend.
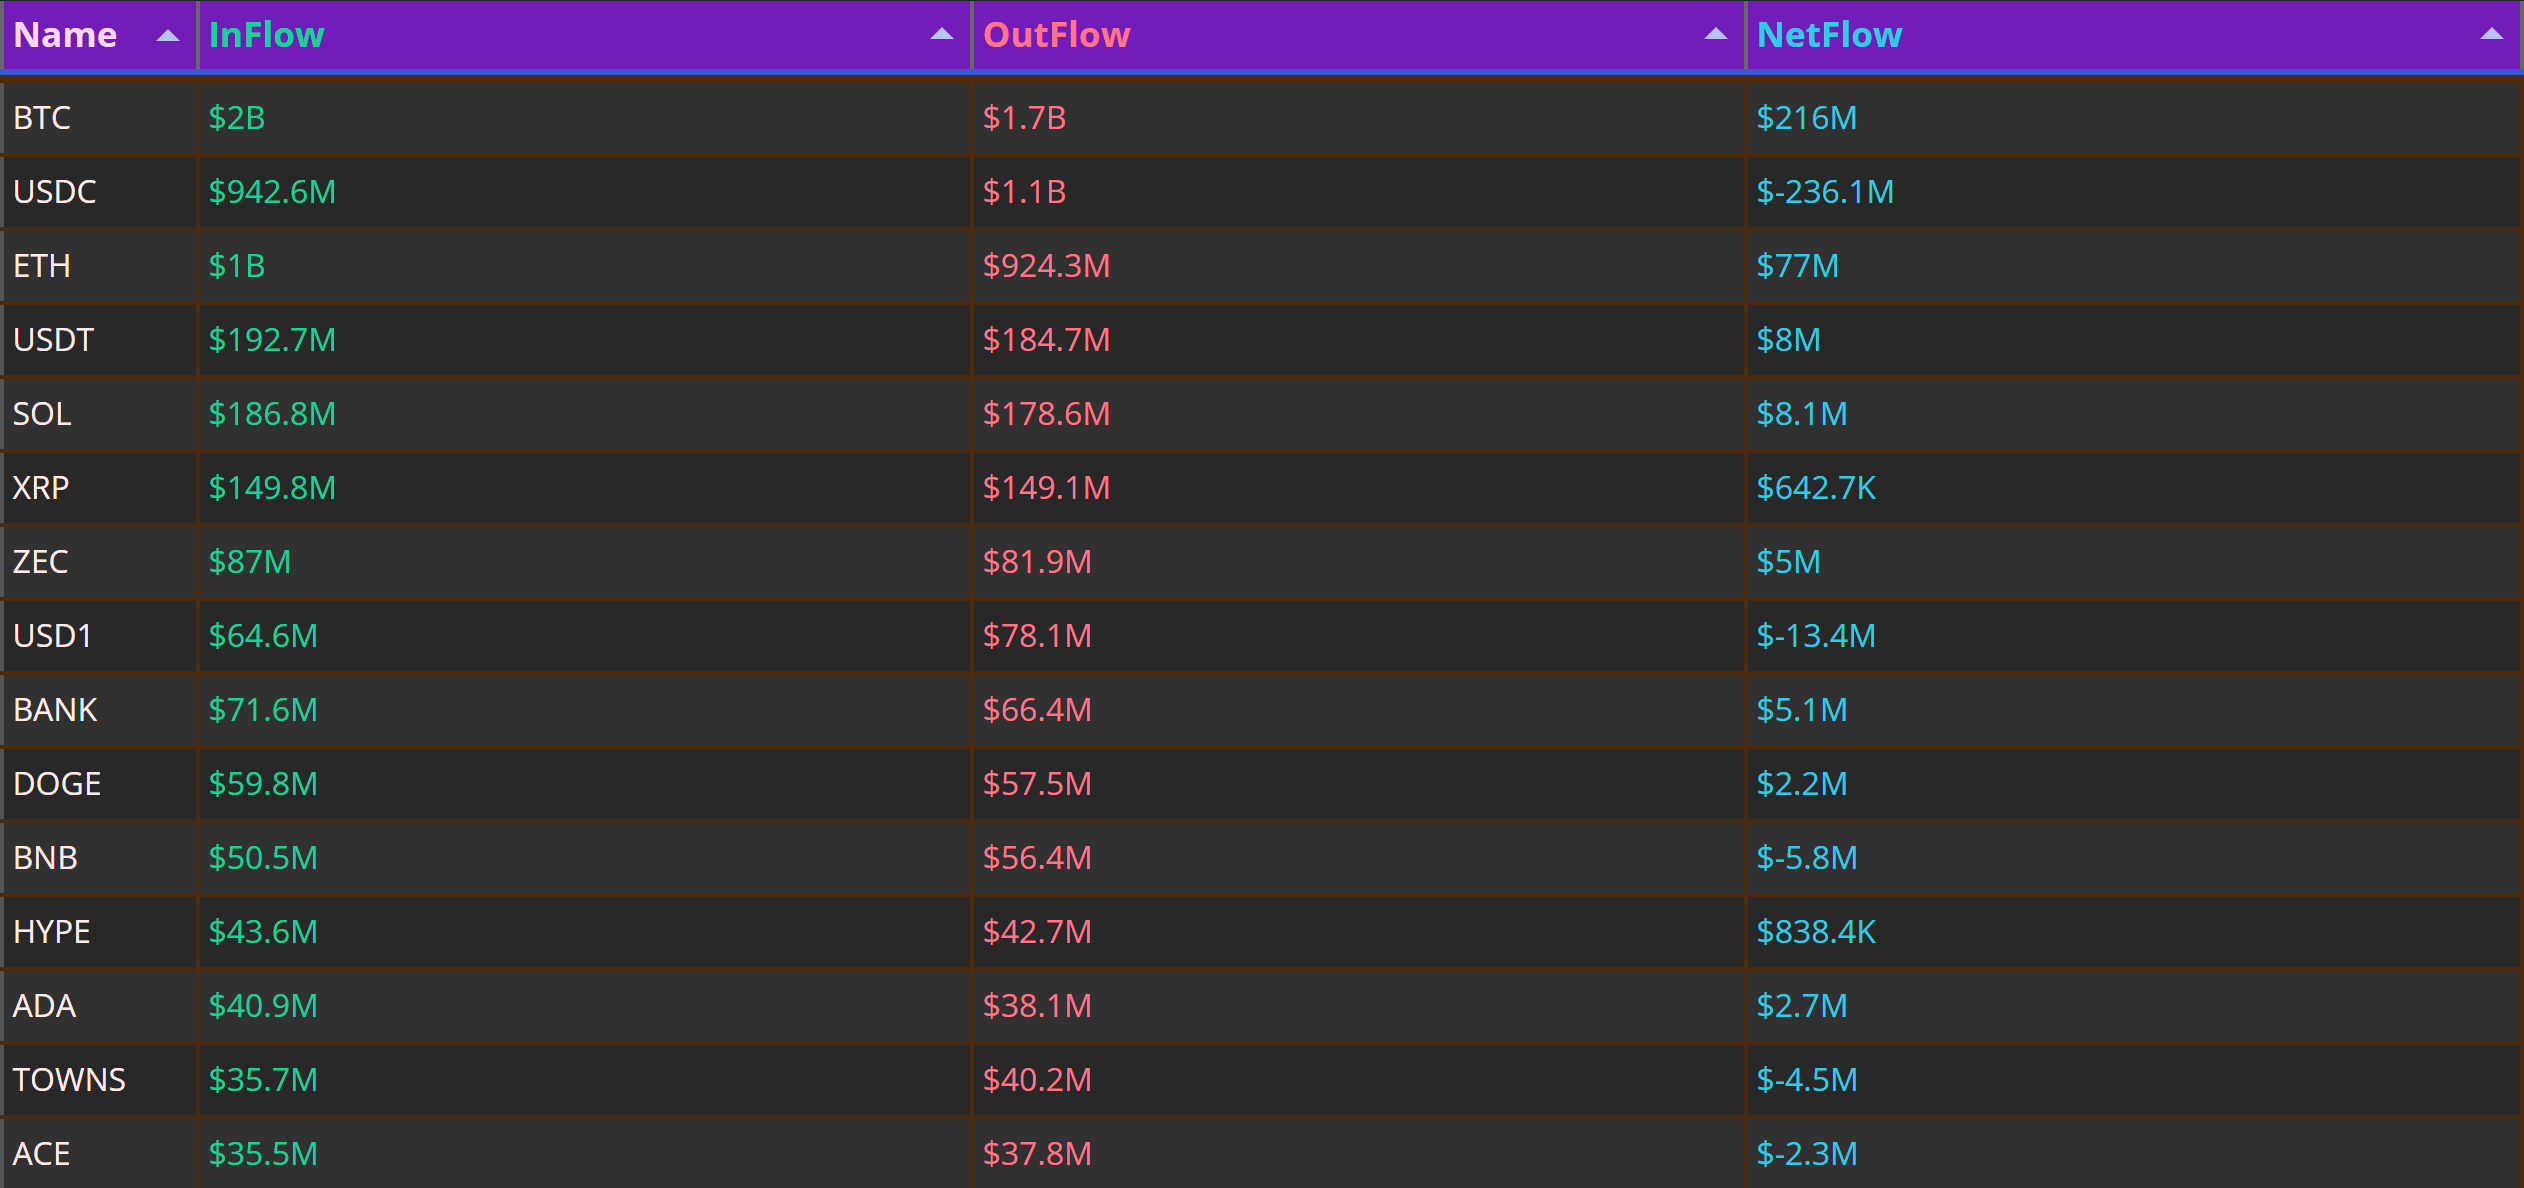
- Liquidity returning: 24H volume rose to $4.7B (+20.72%), indicating renewed participation; this can support breakouts but also increases the likelihood of sharp swings.
- Trend context remains mixed: SOL is +5.11% (60D) but still -32.24% (90D), implying the current move is best read as a recovery attempt until higher resistance levels are reclaimed.
- Price discovery is CEX-led: Reported turnover is overwhelmingly on centralized exchanges (~$4.7B) versus DEX (~$38K), meaning near-term moves may be driven more by order-book flows and derivatives-related positioning than on-chain swapping activity.
- Macro linkage: Near-term direction is framed as highly dependent on BTC/ETH sentiment and broader crypto liquidity conditions.
💡 Strategic Points
- Range to watch: Analysts frame a near-term band of $80–$90; staying above $80 supports a “higher-low” structure, while losing it would weaken the rebound thesis.
- Primary resistance: $90 is highlighted as the key ceiling. A decisive break and hold above $90 could trigger incremental momentum buying and trend-following inflows.
- Volume as a confirmation tool: Rising volume alongside price strength can validate a breakout; rising volume without progress can signal distribution and heightened reversal risk.
- Volatility risk management: With volume expanding day-over-day, traders may expect wider intraday ranges; sizing and stops often matter more in these conditions than precise entries.
- Supply/valuation nuance for investors: Solana has an inflationary issuance model and no fixed max supply. Reported circulating estimates vary (≈575.5M vs self-reported ≈525.2M), which can change market-cap/ratio comparisons.
- Fundamental sensitivity: SOL’s core narrative (high throughput, low fees; DeFi/NFT/gaming ecosystem) tends to respond strongly to risk appetite and liquidity inflows, making it a “beta” asset versus BTC in many market regimes.
📘 Glossary
- Resistance: A price zone where selling pressure historically increases, making it harder for price to move higher (here, $90).
- Support: A level where buying interest tends to appear, helping prevent further declines (here, mid-$80s / $80 zone).
- Market Cap: Token price × circulating supply; used to compare network size (SOL cited around $49.5B depending on supply source).
- Circulating Supply vs Total Issued: Coins considered available to the market versus all coins created (circulating ≈575.5M vs total issued ≈624.8M in the report).
- FDV (Fully Diluted Valuation): Estimated value if all tokens were in circulation; used to gauge potential dilution effects (SOL FDV cited ≈$53.7B).
- CEX vs DEX Volume: Trading on centralized exchanges (order books) versus decentralized exchanges (on-chain swaps). The report indicates SOL’s near-term liquidity is predominantly CEX-driven.
- Liquidity inflow: New capital entering the market that can lift prices and amplify trends; declining liquidity often leads to choppier, range-bound action.


Comment 0