 News
News  Coin Information
  About us
  Customer Service


Solana (SOL) was trading near $84.93 on Monday UTC, hovering just below a closely watched $87 threshold as investors weighed steady spot ETF inflows against a tightening technical range. The move matters because a clean break above the $87 area—roughly aligned with Solana’s 50-day exponential moving average (EMA) near $87.10—would mark a shift in medium-term momentum after weeks of consolidation.
According to CoinMarketCap data cited in the report, SOL was down 1.31% over the past 24 hours but remained up 0.99% on the week. Solana’s market capitalization stood at roughly $48.89 billion, ranking seventh in the broader crypto market with about 1.92% dominance.
Spot ETF inflows reinforce ‘institutional demand’ narrative
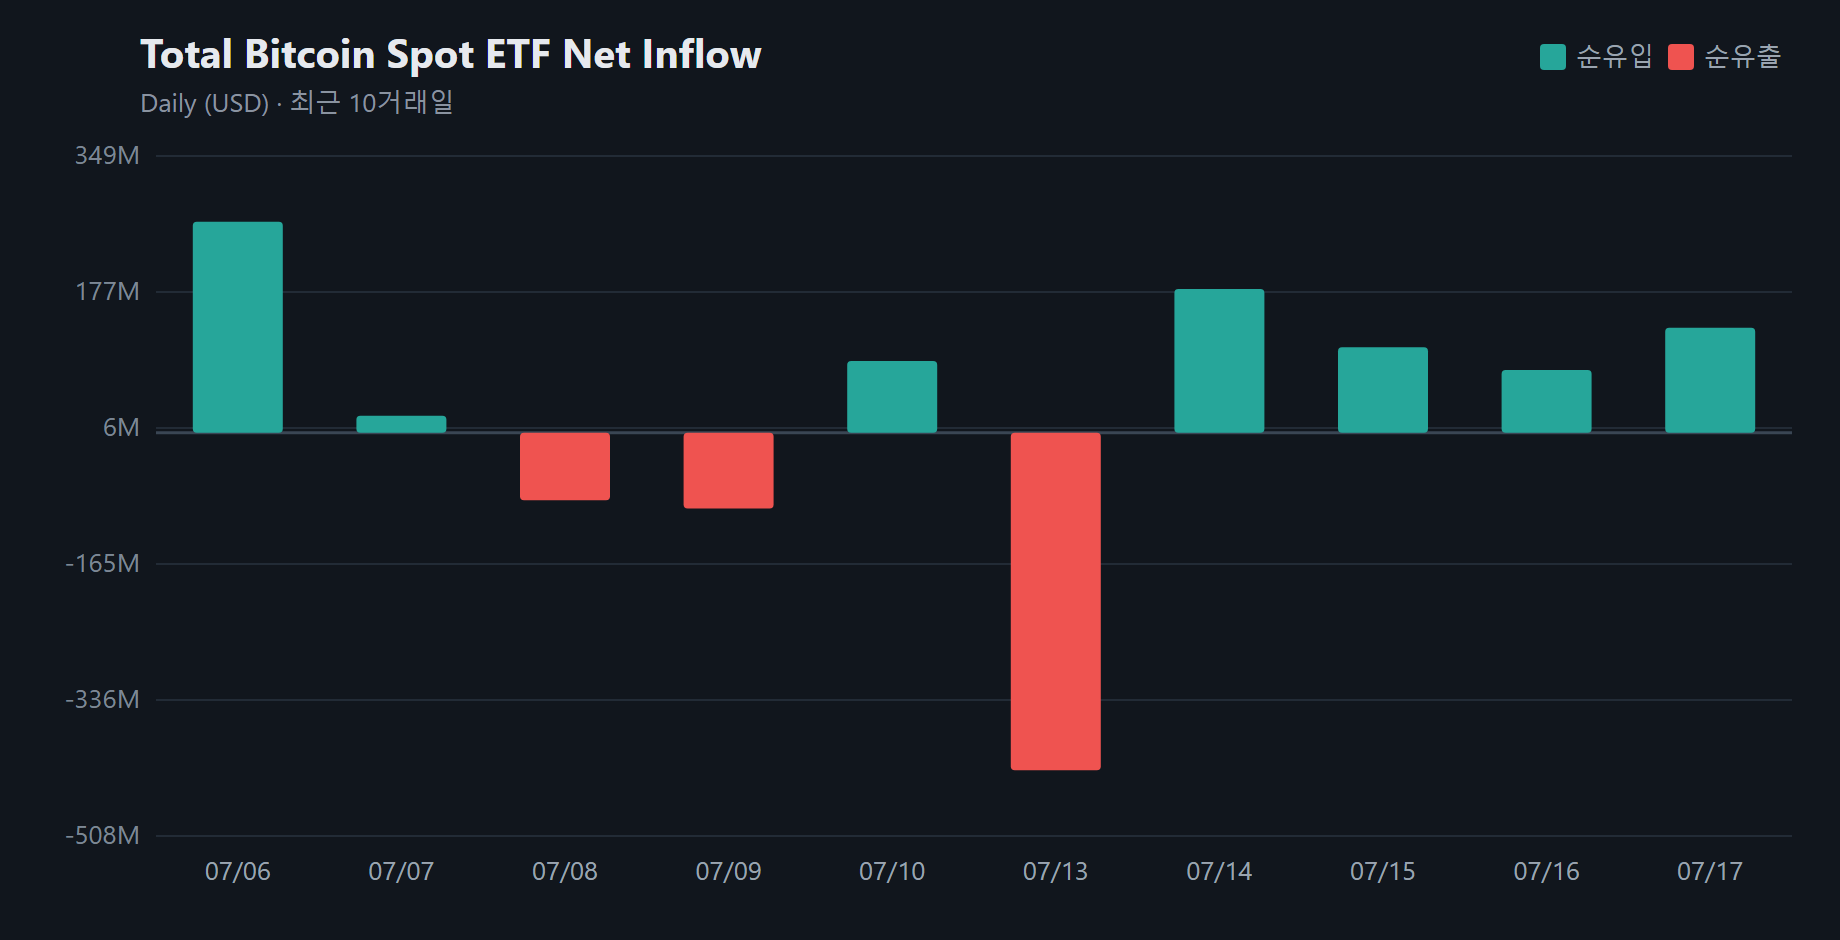
Market attention has increasingly centered on Solana spot ETFs, which have posted five consecutive sessions of net inflows—an indicator analysts often use as a proxy for incremental ‘institutional demand’. On Monday alone, the products recorded an estimated $3.28 million in net inflows, while last week’s total was reported at $35.17 million.
Commentary from crypto-focused outlets including MEXC and FXStreet framed the flow profile as reminiscent of early-stage adoption patterns seen previously in Bitcoin (BTC) and Ethereum (ETH) ETF rollouts. While the absolute numbers are smaller than those flagship assets, the directional consistency has been read as supportive for Solana’s medium-term positioning—particularly if macro risk sentiment remains stable and liquidity conditions do not tighten abruptly.
dApp revenue and DEX volume show sustained on-chain traction
Beyond ETF flows, the report points to Solana’s application layer as a key pillar of the current bid. Over the past seven days, Solana led all blockchains in decentralized application revenue with $16.94 million, ranking first for five consecutive weeks—an outcome that suggests persistent user activity and fee generation on the network.
In first-quarter 2026 decentralized exchange (DEX) spot volume, Solana was reported to have processed approximately $2.845 trillion, translating to 41% market share. If accurate, that scale would underscore Solana’s growing role as a high-throughput venue for on-chain trading compared with other Layer 1 networks, including Ethereum.
Stablecoin metrics also indicate rapid turnover. The average holding time for stablecoins on Solana reportedly fell to 70 seconds, while monthly stablecoin transaction volume was cited at around $1 trillion. Against a backdrop of an estimated $38 billion rise in USDC issuance, the report claims stablecoin circulation velocity on Solana is about six times faster than on Ethereum—an indicator often interpreted as high-frequency usage rather than passive storage.
Lily Liu, president of the Solana Foundation, attributed part of the network’s appeal to ‘unified liquidity’, arguing that the architecture is conducive to building financial applications for a global user base. Her remarks align with a broader thesis among Solana proponents: that a tightly integrated execution environment can reduce fragmentation costs for developers and users.
Firedancer upgrade looms as a second-half catalyst
Another major focus is Firedancer, Solana’s next-generation validator client, which is expected to reach mainnet in the second half of 2026. In recent stress tests, Firedancer reportedly achieved one million transactions per second (TPS), a headline figure that—if replicated under real-world conditions—would represent a dramatic leap from Solana’s current average throughput of roughly 5,500 TPS.
Analysts cited in the report argue the upgrade could deepen Solana’s technical moat by expanding capacity for large-scale consumer applications. Some have responded by lifting long-range price targets, with figures in the report pointing to revised expectations in the $180 to $336 range, contingent on execution, adoption, and broader market conditions.
Key levels: $80 support, $87 resistance
In the near term, technical positioning remains the market’s immediate filter. SOL was reported trading in a narrow band around the mid-$85 area, with a rising wedge pattern on the four-hour chart and repeated tests of resistance near the 50-day EMA at $87.10.
On the downside, the $80–$85 zone was highlighted as the primary support region. A breakdown below that area could open the door to a pullback toward the low-$80s, while more aggressive bearish scenarios outlined in the report point to potential downside toward $67 if broader risk-off conditions emerge.
On the upside, a decisive move above $87.10 with a sustained close could improve the odds of a run toward $90–$96, with more ambitious longer-term projections extending into the $120–$250 range if a broader bull cycle continues. Analysts generally cautioned, however, that such outcomes depend on follow-through in both ETF flows and on-chain activity.
Volume softens as price compresses
The report noted 24-hour trading volume of about $3.91 billion, down 16.68% from the prior day—an attenuation that often accompanies tightening price ranges. Most activity was concentrated on centralized exchanges (CEXs), while DEX volume in the cited dataset appeared comparatively small.
Solana’s circulating supply was listed at approximately 576.51 million SOL, with total supply near 624.91 million and an ‘infinite’ issuance framework. Fully diluted valuation (FDV) was estimated at about $53.08 billion.
For now, market participants appear to be balancing three reinforcing positives—spot ETF inflows, sustained dApp revenue leadership, and anticipation of Firedancer—against the risk that a failure to reclaim $87 could prolong consolidation or trigger a deeper retracement. The next sustained move is likely to be dictated by whether flow-driven demand can overcome technical resistance while on-chain indicators remain resilient.


Comment 0