 News
News  Coin Information
  About us
  Customer Service


Solana (SOL) is consolidating in a tight range as volatility compresses, leaving traders focused on a potential breakout that could set the next directional move. While near-term price action remains muted, analysts say a combination of improving technical signals, steady 'institutional demand,' and fresh ecosystem catalysts—most notably Aave’s debut on Solana—could improve the odds of an upside resolution.
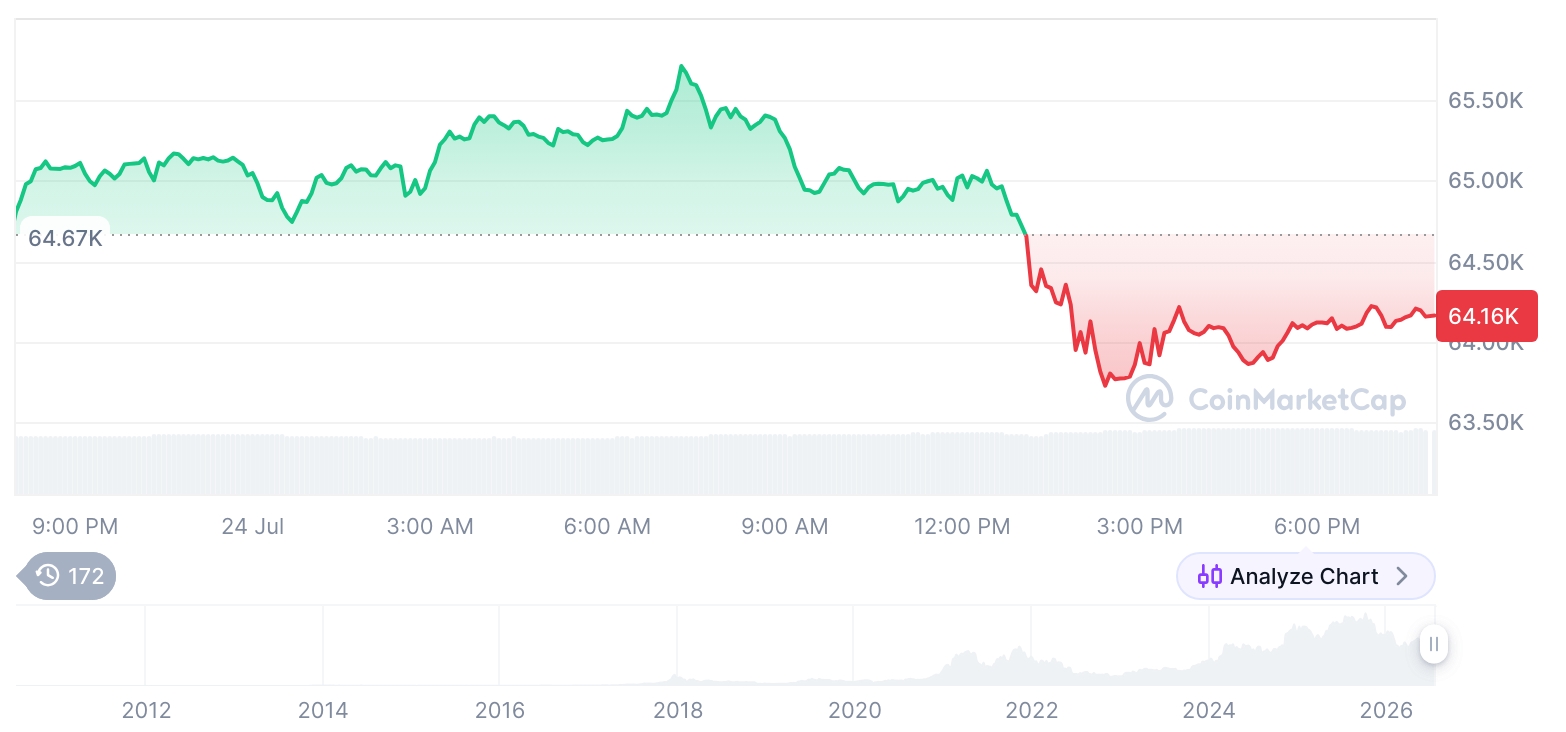
SOL was trading around $88 in the latest session, up roughly 2% over the past 24 hours, according to market data cited in the report. The token has hovered around the mid-$80s, with Bollinger Bands tightening to roughly $77 on the downside and $94 on the upside—an indication that the market is coiling for a larger move. Solana’s market capitalization stood near $50.6 billion, keeping it ranked seventh among cryptoassets by value.
Crypto analyst Ali Martinez described the compressed Bollinger Band range as a 'no-trade zone,' warning that entries inside the band can carry unfavorable risk-reward until price chooses a direction. In that framework, a convincing break above $94 would put the psychologically important $100 level into view, while a drop below $77 could open room for deeper downside, the analyst argued.
Trading activity has cooled alongside the consolidation. Reported 24-hour volume fell more than 23% day over day to about $3.5 billion, underscoring the lower participation typically seen during range-bound periods. The circulating supply was cited at roughly 575.85 million SOL, with the network operating under an inflationary issuance model rather than a fixed cap.
Beyond volatility compression, technicians are also watching momentum indicators. On the weekly chart, the MACD (moving average convergence divergence) has reportedly flashed a buy signal—an event some market participants associate with prior periods when SOL staged sharp rallies. Still, analysts cautioned that historical analogs are not forecasts, and that follow-through tends to be more reliable when expanding volume confirms the trend. A resistance area near $90 was also highlighted as a potential near-term hurdle that could slow any initial rebound.
On the flows side, the report pointed to continued net inflows into spot Solana ETFs over five consecutive sessions, totaling about $1.45 billion. While ETF flow data can be noisy—particularly around rebalancing and hedging—sustained inflows are often read as a sign of improving 'liquidity inflow' and growing institutional engagement.
The same report also cited disclosures indicating Goldman Sachs holds an SOL position valued at roughly $108 million. Market observers framed the position as another data point suggesting Solana may be increasingly viewed as eligible for institutional portfolios rather than purely a high-beta retail trading vehicle.
At the protocol level, Solana received an additional boost from Aave’s launch on the network. Aave, one of the best-known decentralized lending platforms historically rooted in the Ethereum (ETH) ecosystem, expands Solana’s DeFi footprint by offering borrowing and lending primitives that can deepen on-chain liquidity and create new use cases. Supporters argue Solana’s throughput and lower fees could make the chain an attractive venue for certain DeFi activity, though competitive pressure across layer-1 networks remains intense.
The report also described market structure metrics showing centralized exchanges still dominate SOL trading volumes, with CEX activity estimated around $3.5 billion over 24 hours, compared with a far smaller figure attributed to DEX venues in the same snapshot.
Looking further out, some analysts outlined a wide three-year price range—spanning from $50 to above $900—reflecting the sector’s uncertainty and sensitivity to macro conditions, regulation, and competition among smart-contract platforms. A base-case scenario cited SOL in the $200–$300 range if the broader crypto market reaches roughly $5 trillion in total capitalization and Solana maintains around a 3% market share, implying a probability-weighted expectation of roughly $250–$300. Even proponents emphasized that outcomes could diverge sharply depending on market cycles and policy developments.
In recent performance, SOL was modestly higher across short lookback windows—up about 4% over the past week and roughly 7% over 30 days—while still down close to 30% over 90 days, reflecting a broader medium-term correction. For now, traders are treating the $77–$94 band as the key battleground: a break above the upper boundary could revive bullish positioning, while a move below support would likely renew downside pressure.


Comment 0