 News
News  Coin Information
  About us
  Customer Service


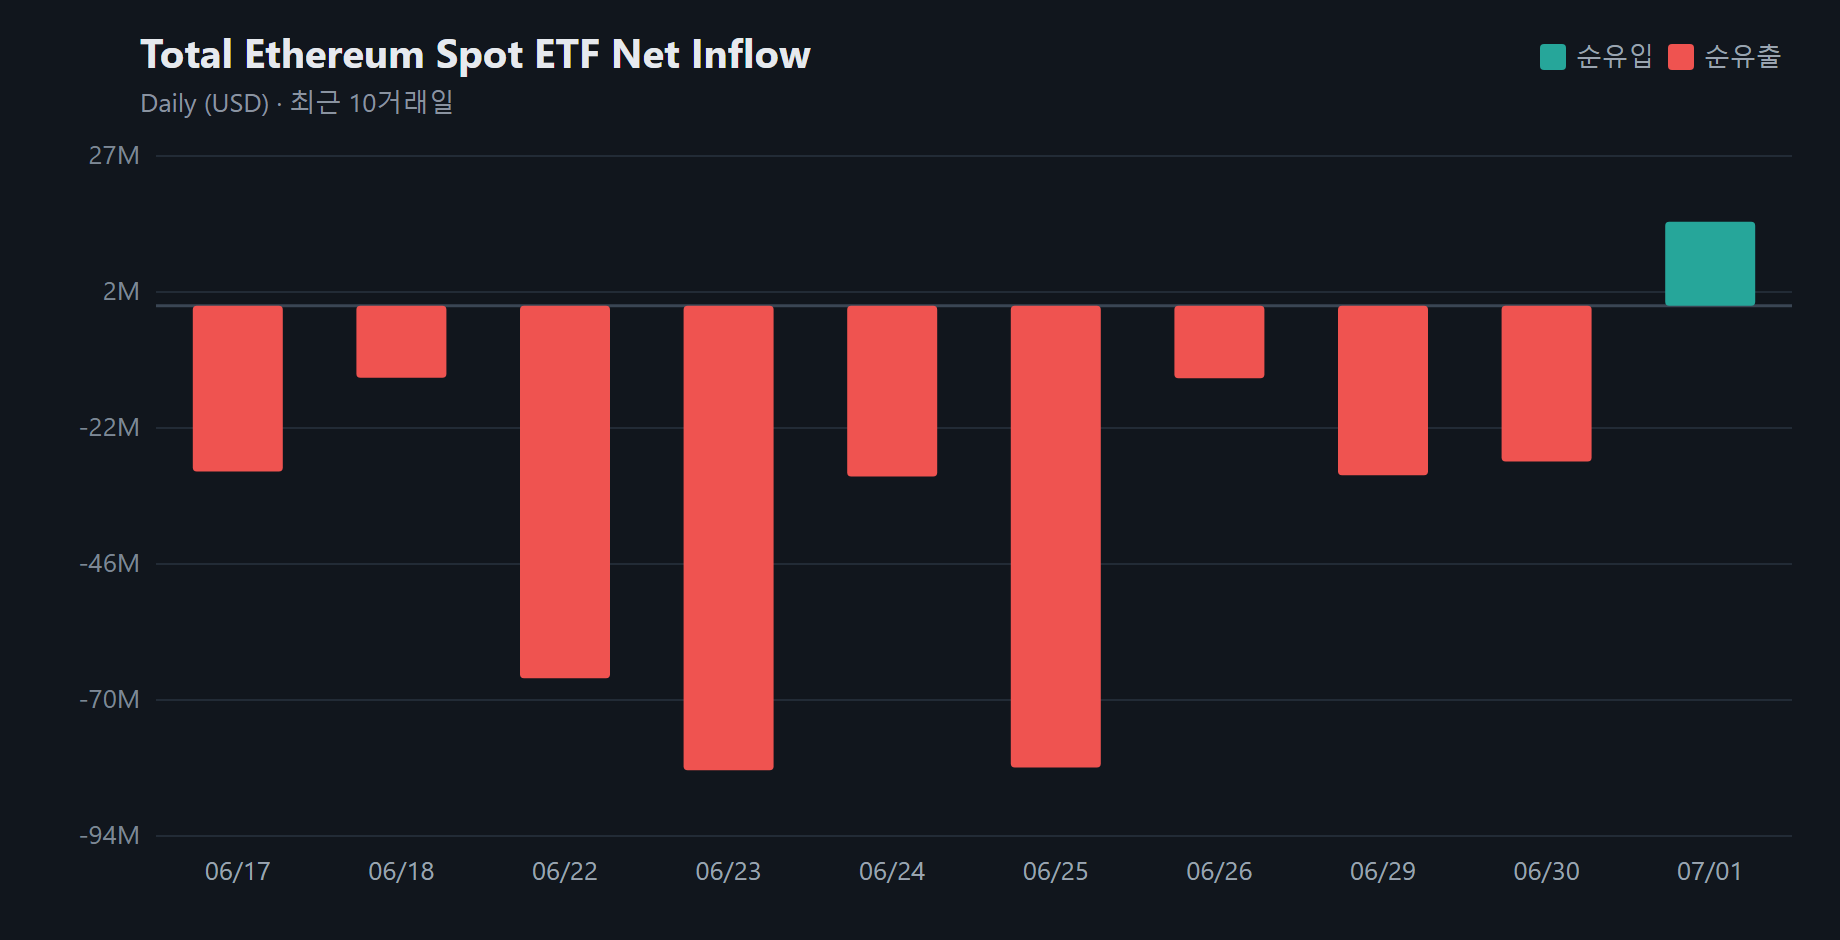
U.S. spot Ethereum (ETH) ETFs returned to net inflows on Tuesday, signaling a tentative shift in sentiment after more than a week of steady redemptions and offering the market a fresh read on 'institutional demand' for ETH exposure.
Data compiled by SosoValue shows spot Ethereum ETFs posted a combined net inflow of $14.89 million on July 1 (U.S. Eastern Time), snapping a nine-session streak of net outflows. Cumulative net inflows across the category now stand at $10.86 billion.
Flows, however, were highly concentrated. BlackRock’s iShares Ethereum Trust ($ETHA) accounted for all net buying with $36.64 million in inflows, while several other products saw withdrawals: Grayscale Ethereum Trust ($ETH) recorded $18.46 million in outflows, BlackRock’s iShares Ethereum Trust 2 ($ETHB) lost $1.67 million, and Fidelity Ethereum Fund ($FETH) saw $1.61 million leave the fund. The remaining ETFs were effectively flat on the day.
Trading activity remained robust, with total daily turnover across the 10 products reaching $503.1 million. BlackRock’s $ETHA led volumes at $389.85 million, followed by Grayscale’s $ETH at $32.14 million and Grayscale Ethereum Trust ($ETHE) at $30.87 million—an indication that liquidity continues to cluster in a handful of flagship vehicles even as flows diverge.
Total net assets across U.S. spot Ethereum ETFs rose to $8.56 billion, roughly 4.39% of Ethereum’s total market capitalization. By assets under management, $ETHA ranked first with $4.40 billion, followed by $ETH at $1.36 billion and $ETHE at $1.25 billion.
The return to net inflows may ease near-term concerns that persistent outflows were becoming a self-reinforcing signal of weakening demand, but the day’s figures also underscore that allocations remain selective rather than broad-based. For market participants, the next key question is whether the inflow reversal develops into a sustained trend—potentially affecting ETH liquidity conditions and broader positioning across crypto risk assets.
🔎 Market Interpretation
- Flow regime shift: U.S. spot Ethereum ETFs recorded $14.89M net inflows on July 1, ending a nine-session outflow streak—an early sign of stabilizing sentiment after sustained redemptions.
- Selective institutional appetite: The reversal was not broad-based; buying was concentrated in a single product (BlackRock’s $ETHA), suggesting investors are choosing specific issuers/structures rather than increasing exposure across the whole ETF complex.
- Liquidity remains strong despite mixed flows: Total turnover reached $503.1M, indicating active positioning and efficient entry/exit even as some funds saw withdrawals.
- “Institutional demand” read-through: The day’s net inflow may reduce fears that outflows were becoming a self-reinforcing bearish signal, but concentration implies demand is still cautious and vehicle-specific.
- Macro positioning implication: If inflows persist, they could support ETH market liquidity and risk appetite across crypto; if they fade, the move may prove to be a one-day normalization rather than a trend change.
💡 Strategic Points
- Watch the leaders, not the average: With all net buying coming from $ETHA (+$36.64M), headline “category inflows” may mask weakness elsewhere (e.g., $ETH -$18.46M, $ETHB -$1.67M, $FETH -$1.61M).
- Confirm trend via multi-day follow-through: A single positive day after nine outflow sessions is best treated as a signal to monitor; look for consecutive inflow days and improving breadth across issuers.
- Liquidity clustering matters for execution: Volume was highly concentrated in $ETHA ($389.85M) versus the next products ($ETH $32.14M, $ETHE $30.87M). Traders may prefer flagship vehicles for tighter spreads and lower market impact.
- Track ETF footprint vs. ETH market size: Total net assets were $8.56B (~4.39% of ETH market cap). Changes in this share can hint at whether ETF demand is meaningfully influencing spot market dynamics.
- Positioning risk: Continued outflows in legacy products alongside inflows into newer/cheaper funds can indicate rotation rather than outright risk-on behavior—important for interpreting price moves.
📘 Glossary
- Spot Ethereum ETF: An exchange-traded fund designed to track ETH by holding ETH (or closely linked spot exposure), offering regulated access via traditional brokerage accounts.
- Net inflow / net outflow: The daily net value of creations (money entering the ETF) minus redemptions (money leaving the ETF).
- Turnover (trading volume): Total dollar value traded in the ETFs during the day; indicates activity and liquidity, not necessarily investor net buying.
- Total net assets (AUM): The market value of assets held by the ETF(s); used to gauge size and potential market influence.
- Liquidity clustering: When trading activity concentrates in a few dominant products, often resulting in better execution quality in those vehicles.
- Institutional demand: A shorthand for large, professionally managed allocation interest (e.g., asset managers, advisors), often inferred from sustained ETF creations and rising AUM.


Comment 0