
 Add as a preferred source on Google
Hyperliquid Staking Market Cap Drops 12% as Ethereum, Solana Hold Steady
Hyperliquid led weekly declines with a 12.59% drop in staked market cap while Ethereum and Solana remained stable, highlighting diverging sentiment across major staking networks.









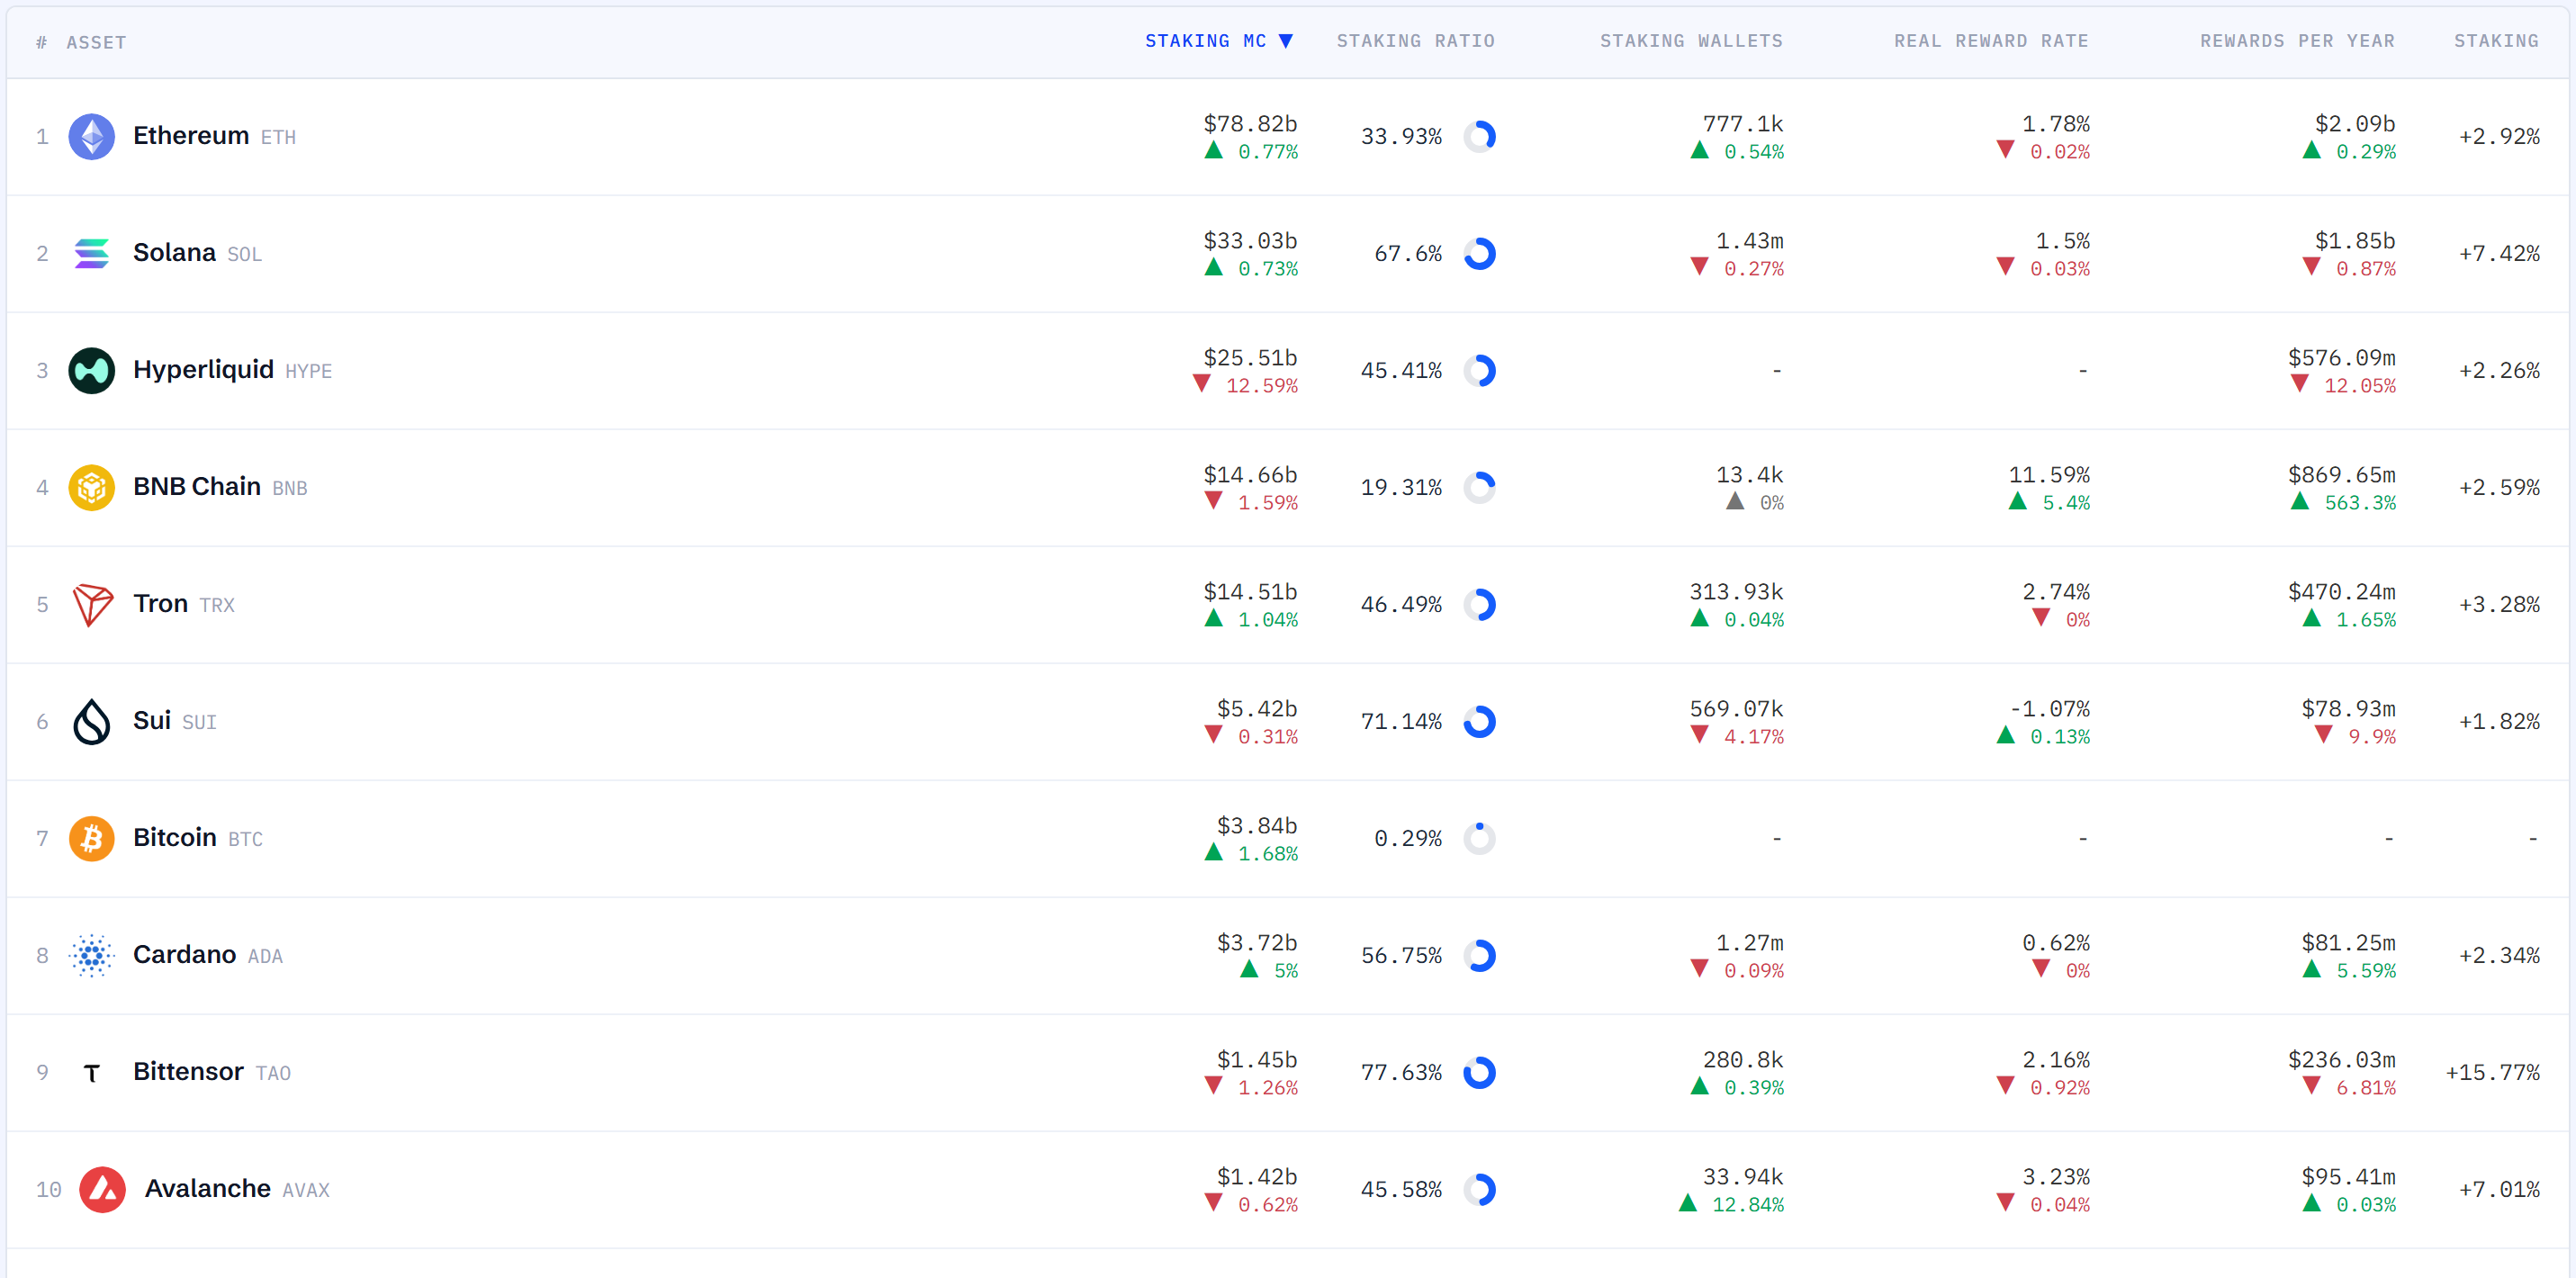
Staking markets showed a split performance over the past week, with major networks largely holding steady while Hyperliquid (HYPE) posted a notably sharp drawdown—highlighting how quickly sentiment can diverge even among the largest proof-of-stake ecosystems.
As of Wednesday at 2:50 a.m. ET (based on a staking reward data snapshot taken Thursday 02:50 a.m. KST), Ethereum (ETH) remained the largest staking asset by market capitalization, rising 0.77% week-on-week to about $78.82 billion. Solana (SOL) held second place at roughly $33.03 billion, up 0.73% over the same period.
The most pronounced move came from Hyperliquid, which was measured at approximately $25.51 billion in staked market cap but fell 12.59% week-on-week—the steepest decline among the top tier. BNB Chain (BNB) ranked fourth at about $14.66 billion, down 1.59%, while Tron (TRX) rounded out the top five with $14.51 billion, up 1.04%.
Among notable weekly changes, Cardano (ADA) led the gainers with a 5.00% increase in staked market cap, while Bitcoin (BTC)—included in the dataset as a staking-related metric—rose 1.68%. On the downside, the week’s pullback was concentrated in Hyperliquid and, to a lesser extent, BNB Chain.
Participation metrics painted a different picture from price-driven market cap shifts. By staking ratio (staked supply relative to circulating supply), Bittensor (TAO) topped the list at 77.63%, followed by Sui (SUI) at 71.14% and Solana at 67.60%. Cardano posted 56.75%, Tron 46.49%, and Avalanche (AVAX) 45.58%, suggesting that several networks continue to see strong validator and delegator engagement despite volatile prices.
Wallet activity, often used as a proxy for retail participation and delegation breadth, was led by Solana with around 1.43 million staking wallets. Cardano followed with 1.27 million, while Ethereum recorded about 780,000. Week-on-week changes were modest overall, though Avalanche’s staking wallet count rose 12.84%, while Sui’s fell 4.17%.
On realized reward rates, BNB Chain continued to stand out at 11.59%, the highest among the networks tracked. Avalanche posted 3.23%, Tron 2.74%, Bittensor 2.16%, Ethereum 1.78%, and Solana 1.50%. Sui remained in negative territory at -1.07%, underscoring how staking outcomes can be heavily influenced by token price dynamics and network-specific reward mechanics.
Estimated annual reward value still skewed toward the largest ecosystems. Ethereum led with about $2.09 billion in annualized rewards, followed by Solana at roughly $1.85 billion. BNB Chain was estimated at $869.65 million, Hyperliquid at $576.09 million, and Tron at $470.24 million.
However, weekly changes in estimated annual rewards were unusually uneven. BNB Chain’s annual reward estimate surged 563.30%, while Cardano climbed 5.59% and Tron increased 1.65%. By contrast, Hyperliquid dropped 12.05%, Sui declined 9.90%, and Bittensor fell 6.81%—moves that point to rapidly shifting reward value assumptions tied to both token price and staking base changes.
Looking at staking annual ROI (a yield-focused measure), Bittensor ranked first at 15.77%. Solana came in at 7.42% and Avalanche at 7.01%, with Tron at 3.28% and Ethereum at 2.92%. BNB Chain was measured at 2.59%, followed by Cardano at 2.34%, Hyperliquid at 2.26%, and Sui at 1.82%.
A longer-horizon view reinforced the dominance of price action over yield. For 365-day total ROI—combining token price changes with staking rewards—Hyperliquid led with 84.35%, while Tron was the only other network in positive territory at 18.58%. Most of the rest posted deep negative results: Sui at -74.64%, Cardano at -70.03%, Avalanche at -61.51%, Solana at -43.83%, Ethereum at -29.26%, Bittensor at -25.22%, and BNB Chain at -11.93%.
The data suggests that while staking can provide a steady stream of rewards and may signal strong network participation, it has not been enough to offset broad token price declines across much of the sector over the past year—leaving total returns highly dependent on market direction rather than yield alone.
Article Summary by TokenPost.ai
🔎 Market Interpretation
Large-cap staking stayed resilient: Ethereum ($78.82B staked market cap, +0.77% WoW) and Solana ($33.03B, +0.73%) were broadly stable, signaling steady capital anchoring in top PoS ecosystems.
Sentiment split widened sharply: Hyperliquid (HYPE) saw the biggest weekly drawdown in staked market cap ($25.51B, -12.59% WoW), showing how quickly narratives can diverge even among “top-tier” networks.
Participation strength ≠ price performance: High staking ratios (e.g., Bittensor 77.63%, Sui 71.14%, Solana 67.60%) indicate strong lock-up/engagement, yet several of these assets still suffered poor longer-term total returns.
Rewards explain only part of outcomes: BNB Chain posted the highest realized reward rate (11.59%), but 365-day total ROI remained negative for most assets—highlighting token price as the dominant driver of investor returns.
One-year picture remains risk-off: Hyperliquid (+84.35%) and Tron (+18.58%) were the only networks with positive 365-day total ROI; others were deeply negative (e.g., Sui -74.64%, Cardano -70.03%, Avalanche -61.51%).
💡 Strategic Points
Differentiate “yield” from “total return”: Annual ROI (yield-focused) leaders like Bittensor (15.77%) and Solana (7.42%) do not guarantee positive outcomes when price trends are adverse; assess staking as a supplement, not a hedge, in down markets.
Watch reward value estimates for regime shifts: BNB Chain’s estimated annual rewards jumped +563.30% WoW, an outlier move that may reflect sharp changes in price assumptions, staking base, or calculation inputs—worth validating before extrapolating.
Use staking ratio as a “commitment” signal: Very high ratios (TAO, SUI) can imply strong holder conviction and potential reduced liquid supply, but also raise sensitivity to unlock/unstake events if sentiment flips.
Track wallet counts for retail breadth: Solana led in staking wallets (~1.43M), followed by Cardano (~1.27M) and Ethereum (~780k). Notable shifts—Avalanche wallets +12.84% WoW; Sui -4.17%—can indicate changing delegation participation.
Flag negative realized reward rates: Sui at -1.07% underscores that “realized” outcomes can be dragged down by token price dynamics or specific reward mechanics; investors should evaluate reward tokenomics, inflation, and sell pressure.
Risk management for volatile leaders: Hyperliquid’s sharp weekly staked market cap decline (-12.59%) despite leading 365-day total ROI suggests elevated momentum risk; consider position sizing, unstake/lockup constraints, and liquidity conditions.
📘 Glossary
Staked Market Cap: The value of tokens currently staked (typically staked amount × token price), used as a proxy for capital committed to network security and staking demand.
Staking Ratio: The percentage of circulating supply that is staked (staked supply ÷ circulating supply). Higher values often indicate stronger participation and lower immediate liquid supply.
Staking Wallets: The number of wallets participating in staking/delegation; often used as a rough indicator of participation breadth and retail activity.
Realized Reward Rate: A realized/observed reward measure over a period; can be affected by reward emissions, fees, and token price movements depending on methodology.
Estimated Annual Reward Value: A dollar-value estimate of rewards distributed over a year, typically combining emission rates and token price assumptions.
Annual ROI (Staking): Yield-focused return estimate from staking rewards, generally excluding token price appreciation/depreciation.
365-day Total ROI: Total return over one year combining token price changes and staking rewards; often dominated by price direction in volatile markets.