 News
News  Coin Information
  About us
  Customer Service


BTC/USD chart - Trading View
Exchange - Coinbase
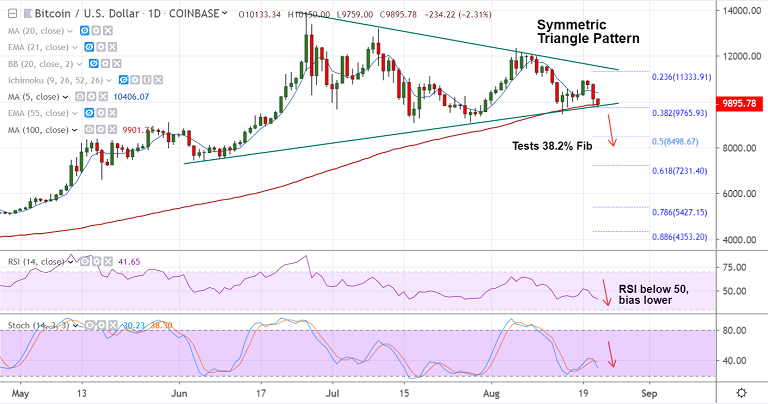
Support: 9446 (110-EMA); Resistance: 10392 (5-DMA)
Technical Analysis: Bias Bearish
BTC/USD edges higher from session lows at 9759, trades 1.98% lower at 9929 at 03:15 GMT.
The pair is extending weakness for the 3rd straight session after upside was rejected at 20-DMA resistance.
Price action briefly dipped below 100-DMA to test 38.2% Fib at 9765, technical studies are bearish.
Stochs are RSI are sharply lower and RSI is well below 50 levels. Intraday volatility is rising.
Price action rages in 'Symmetric Triangle pattern and breach below Triangle base could plummet prices further.
Next major support lies at 110-EMA at 9448. Immediate resistance is at 5-DMA at 10406. Break above 20-DMA required for upside continuation.


Comment 0