 News
News  Coin Information
  About us
  Customer Service


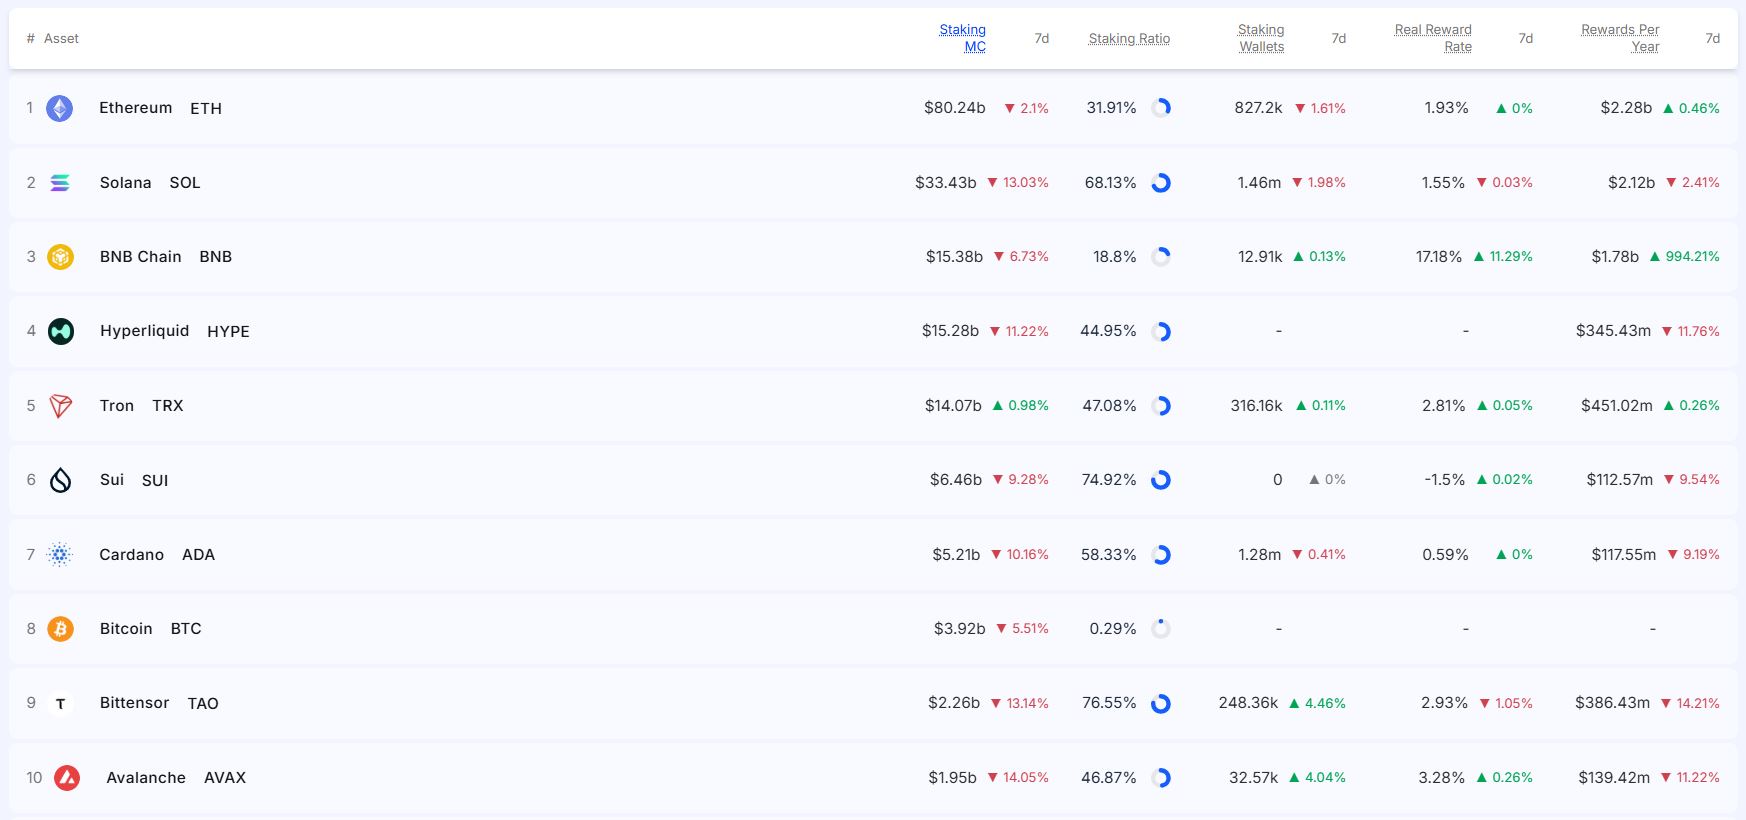
Staking markets remained broadly risk-off this week, with most major networks seeing declines in staked market capitalization even as a handful of ecosystems attracted selective inflows on the back of improving yields and rising participation. The standout was BNB Chain, where estimated annual rewards surged nearly tenfold over the past seven days—an outlier move that contrasted sharply with the wider market’s cooling activity.
According to data compiled by Staking Rewards and reviewed on April 2 UTC, Ethereum (ETH) удержed the top spot by staked market cap despite a weekly decline. ETH’s staked market value fell 2.1% week over week to $80.24 billion, underscoring a mild pullback in the largest proof-of-stake ecosystem by value. Solana (SOL) remained second at $33.43 billion, but its staked market cap dropped 13.03% over the same period, pointing to an ongoing short-term rotation away from higher-beta networks.
BNB (BNB) ranked third with a staked market cap of $15.38 billion, down 6.73% on the week, but it regained its place in the top tier after overtaking Hyperliquid, which fell 11.22%. Among the major assets tracked, Tron (TRX) was the only one to post a weekly gain, edging up 0.98% while most competitors recorded steeper drawdowns. Avalanche (AVAX) posted the largest decline at 14.05%, followed by Bittensor (TAO) at 13.14% and Solana at 13.03%.
Participation indicators painted a more nuanced picture. By staking ratio—staked supply relative to circulating supply—Bittensor led at 76.55%, followed by Sui (SUI) at 74.92% and Solana at 68.13%, suggesting these networks maintain comparatively tight liquid float due to high token lock-up. In terms of active staking wallets, Solana ranked first with roughly 1.46 million wallets, ahead of Tron at 1.28 million and Ethereum at about 827,200. Notably, Bittensor and Avalanche each recorded weekly wallet growth in the 4% range, signaling expanding engagement even as headline staked valuations fell.
Yield dynamics also diverged sharply across chains. On a realized basis, BNB Chain posted the highest ‘effective yield’ at 17.18%, up 11.29 percentage points from the prior week—a jump that helped explain the renewed attention to its reward profile despite the decline in staked market cap. Avalanche followed at 3.28%, with Bittensor at 2.93% and Tron at 2.81%. Ethereum’s effective yield stood at 1.93%, while Solana’s was 1.55%. Sui remained in negative territory at -1.5%, indicating that net returns—after adjustments such as inflation or other offsets commonly reflected in realized-yield models—still fail to compensate stakers on the same basis as peers.
Measured by estimated annual rewards in dollar terms, Ethereum continued to dominate with $2.28 billion, narrowly ahead of Solana at $2.12 billion. BNB ranked third at $1.78 billion. The most dramatic change, however, came from BNB Chain: its estimated annual reward figure jumped 994% over the past week, the largest increase among tracked networks. By contrast, several assets saw reward estimates contract over the same period, including Bittensor (-14.21%), Avalanche (-11.22%), Sui (-9.54%), and Cardano (ADA) (-9.19%), reflecting a mix of price-driven effects and shifting staking dynamics.
Overall, this week’s data suggested a market still de-risking in aggregate—visible in falling staked market caps—while capital and user activity selectively gravitated toward networks offering notably improved ‘real yield’ profiles or growing participation. If the divergence between staking valuation and reward momentum persists, investors may continue to differentiate more sharply between chains based on sustainable yield sources and the stability of staking participation rather than market size alone.
🔎 Market Interpretation
- Broad risk-off in staking: Most major networks saw weekly declines in staked market capitalization, signaling de-risking even within proof-of-stake ecosystems.
- ETH still leads, but softening: Ethereum remained #1 by staked market cap at $80.24B (-2.1% WoW), showing mild pullback rather than capitulation.
- Higher-beta weakness: Solana held #2 at $33.43B but fell -13.03%, consistent with rotation away from more volatile staking assets.
- BNB Chain anomaly: Despite a staked market cap decline ($15.38B, -6.73%), BNB Chain’s reward/yield metrics surged sharply, standing out versus the broader cooling trend.
- Mixed performance among majors: Tron was the only weekly gainer in staked market cap (+0.98%), while Avalanche saw the steepest drop (-14.05%).
- Divergence theme: The market shows a split between falling staking valuations and selective reward momentum, suggesting investors are increasingly discriminating on sustainability and participation rather than size alone.
💡 Strategic Points
- Yield shocks can override price weakness temporarily: BNB Chain posted the highest effective yield at 17.18% (+11.29pp WoW) and a 994% WoW jump in estimated annual rewards—a profile that can attract tactical yield-seekers even if staked market cap is falling.
- Don’t equate staked market cap with participation strength: Wallet growth on Bittensor and Avalanche (~+4% WoW) indicates expanding engagement despite declining staked valuations—use participation metrics to confirm network stickiness.
- Liquidity/float matters for volatility: High staking ratios (Bittensor 76.55%, Sui 74.92%, Solana 68.13%) imply tighter liquid float, which can amplify price moves in either direction and affect reward $-values.
- Differentiate “headline APR” vs realized return: Effective yield rankings (BNB 17.18% vs ETH 1.93% vs SOL 1.55%) highlight that realized models can diverge materially from nominal rates; compare like-for-like when assessing carry.
- Watch negative realized yield as a red flag: Sui’s -1.5% effective yield suggests inflation/offsets are overwhelming staking benefits, potentially pressuring staking demand unless fundamentals or incentives improve.
- Scale still concentrates reward dollars: Ethereum remains #1 in estimated annual rewards ($2.28B), narrowly ahead of Solana ($2.12B), implying that large ecosystems can maintain dominant reward flows even when yields look lower.
- Near-term positioning framework:
- Defensive tilt: Favor networks with stable participation and modest drawdowns (e.g., ETH, TRX) when risk-off persists.
- Tactical yield trade: Monitor BNB’s elevated effective yield for sustainability and the source of reward expansion (incentives vs organic fees).
- Risk management: For higher-beta chains (SOL, AVAX), require confirmation via stabilizing staked market cap or improving wallet participation before adding exposure.
📘 Glossary
- Staked market cap: The market value (USD) of tokens currently staked/locked for network security or consensus participation.
- Staking ratio: The percentage of circulating supply that is staked. Higher ratios generally reduce liquid float and can increase price sensitivity.
- Effective yield (realized yield): A yield measure adjusted for factors such as inflation, emissions, or other offsets—intended to reflect net return rather than nominal APR.
- Estimated annual rewards: Projected yearly staking rewards, often expressed in USD and influenced by token price, staked amount, and protocol reward schedules.
- Active staking wallets: The number of distinct wallets participating in staking, used as a proxy for decentralization and user engagement.
- Risk-off: Market condition where investors reduce exposure to volatile assets, favoring perceived stability, liquidity, or lower volatility.
- Higher-beta networks: Assets that tend to move more than the broader market (up and down), often reflecting higher volatility and risk appetite sensitivity.
- Liquid float: The portion of supply available for trading (not locked/staked), impacting liquidity and potential price swings.


Comment 0