 News
News  Coin Information
  About us
  Customer Service


Bitcoin (BTC) edged higher on Thursday, clawing back into the upper $71,000s, but the rebound is being met with a familiar constraint: fading participation. With spot volumes slipping even as price rises, traders are increasingly treating the move as a ‘technical bounce’ inside a well-worn ‘$70,000 range’ rather than the start of a fresh uptrend.
As of 2:22 a.m. UTC on April 10, BTC was trading at $71,986, up 1.96% over the prior day. The recovery extends a choppy week in which gains and pullbacks have alternated—an increasingly common ‘volatility compression’ pattern that typically precedes a directional break, but offers limited clarity until liquidity returns.
That liquidity has been the missing ingredient. Aggregate trading volume fell 4.29% to $39.07 billion, a divergence that often signals weakening follow-through. “When price rises on declining volume, it’s harder to argue that new demand is taking control,” one market participant said, describing the move as more consistent with short covering and incremental spot buying than broad risk-on positioning.
Macro signals were modestly supportive. The S&P 500 rose 0.62% while gold fell 0.72%, a backdrop that generally aligns with improved appetite for risk assets. Yet Bitcoin’s comparatively muted response suggests that crypto-specific positioning and flows are currently doing more to shape price action than top-down catalysts.
Momentum indicators also painted a split picture. On the daily timeframe, the MACD rose to 380.14, indicating strengthening near-term momentum. On the weekly chart, however, MACD remained deeply negative at -8,435.02, implying that the market is still working through lingering medium-term downside pressure. The result is an ongoing tension between ‘short-term recovery’ and ‘higher-timeframe resistance’—a setup that can sustain range trading until one side capitulates.
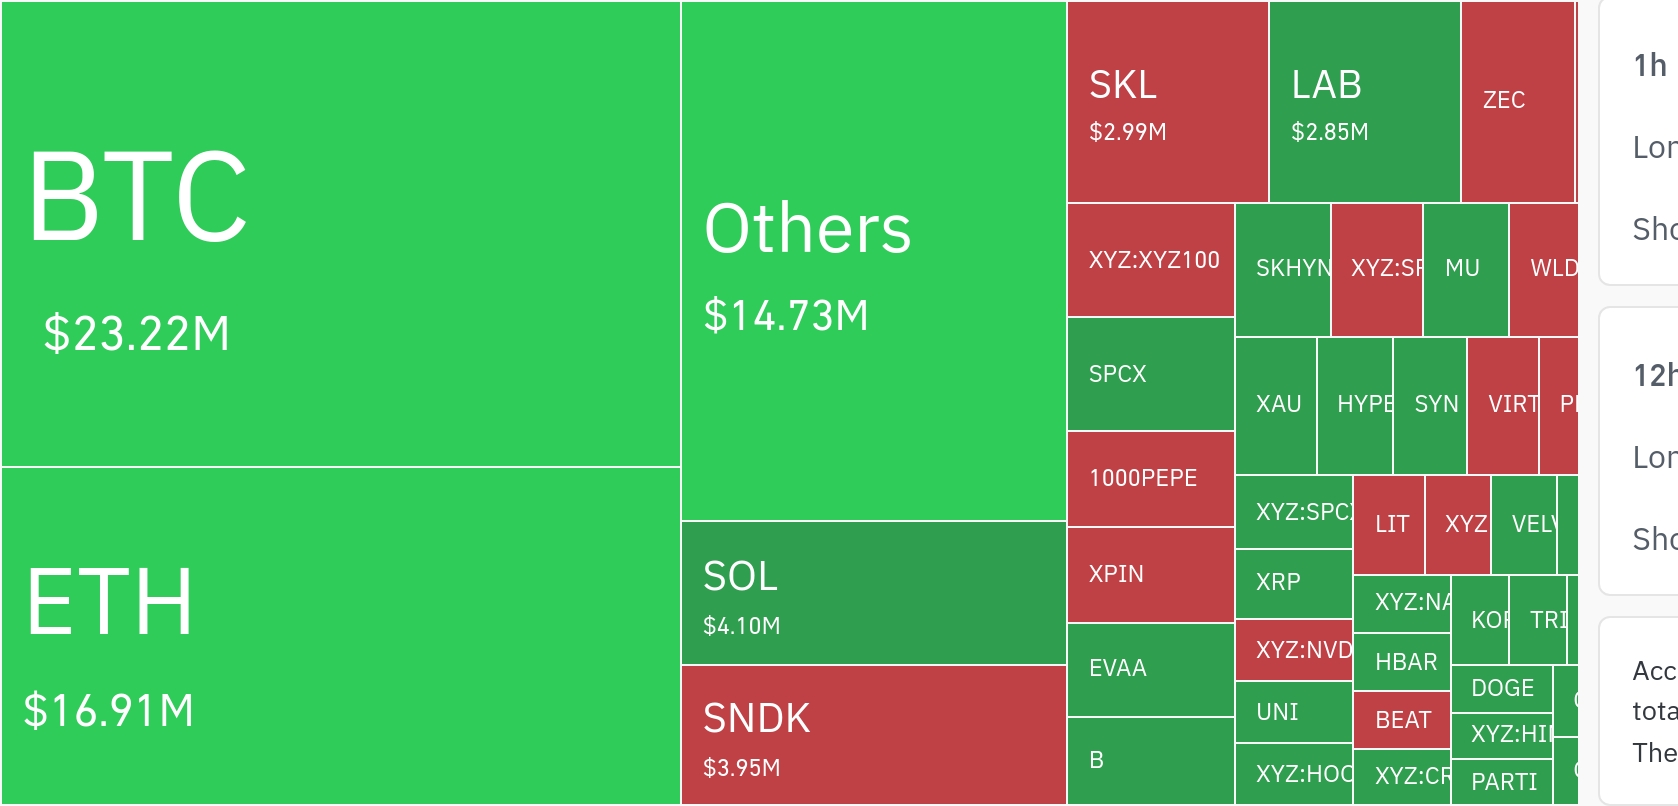
Positioning data hinted at cautious preference for Bitcoin over altcoins. Bitcoin dominance climbed to 59.00% (+0.27%), a sign that capital is rotating back toward the perceived safety of the largest asset rather than dispersing into higher-beta tokens. Sentiment remained undecided: the Crypto Fear & Greed Index held at 50 (‘neutral’), reinforcing the view that many participants are waiting for confirmation before committing fresh capital.
Retail attention, meanwhile, appeared to cool despite the price lift. Google Trends interest slipped to 61 from 62, suggesting the rebound has not yet reignited broader public engagement—often a key accelerant for sustained upside during strong bull phases.
On-chain and flow indicators offered mixed support. The SSR (stablecoin supply ratio), which measures Bitcoin’s market cap relative to stablecoin liquidity, rose 1.01% to 10.621, implying that BTC is becoming slightly more “expensive” relative to available ‘dry powder’ and may require new inflows to push decisively higher. NUPL (net unrealized profit/loss) increased to 0.2422, indicating a growing share of holders sitting on profits—an encouraging sign for confidence, but also a condition that can raise the likelihood of incremental profit-taking on rallies.
Exchange data leaned modestly constructive. Total exchange balances dipped 0.09% to 2.7057 million BTC, while net flows showed an outflow of roughly 2,311 BTC, consistent with investors moving coins off trading venues—typically associated with reduced immediate sell pressure. Yet network activity softened: active addresses fell to 612,454 from 643,056 the day before, underscoring that user participation is not expanding in step with price.
For now, Bitcoin’s rebound has reaffirmed the market’s core dilemma: supportive signs like exchange outflows and improving daily momentum are being offset by thinning volume and slowing activity. Unless participation picks up and the asset can convincingly clear recent highs, the path of least resistance remains continued consolidation inside the ‘$70,000 box’—a holding pattern with increasing potential energy, but no confirmed breakout.
🔎 Market Interpretation
- Price action: Bitcoin rebounded to the upper $71,000s (around $71,986, +1.96% daily), but the move is widely viewed as a technical bounce within the $70,000 range rather than a confirmed trend reversal.
- Key divergence: Volume fell (~4.29% to $39.07B) while price rose—often signaling weak follow-through and a rally driven more by short covering/spot nibbling than fresh demand.
- Volatility setup: Alternating gains and pullbacks suggest volatility compression, which can precede a breakout, but the direction remains unclear without stronger liquidity.
- Macro context: Risk backdrop was mildly supportive (S&P 500 up, gold down), yet BTC’s relatively muted response implies crypto-native flows/positioning are dominating near-term moves.
- Momentum is split by timeframe: Daily MACD improved (380.14) while weekly MACD stayed deeply negative (-8,435.02), reinforcing a tug-of-war between short-term recovery and higher-timeframe resistance.
- Positioning tone: BTC dominance rose to 59.00%, hinting at rotation toward perceived safety vs. altcoins; Fear & Greed stayed neutral (50), reflecting indecision.
- Participation weakening: Google Trends cooled slightly (61→60s) and active addresses fell (to 612,454 from 643,056), suggesting the rebound is not yet pulling in broader engagement.
- Flows/on-chain mixed: Exchange balances slipped (-0.09% to 2.7057M BTC) and net flows showed an outflow (~2,311 BTC), mildly constructive, but not enough to offset thinning demand signals.
💡 Strategic Points
- Range-trading remains the base case: Until BTC breaks and holds above recent highs with rising spot volume, conditions favor continued consolidation inside the “$70,000 box”.
- Watch for confirmation via liquidity: A more durable upside move would likely require volume expansion plus improving participation (active addresses/spot flows) rather than price-only strength.
- Timeframe alignment matters: Daily momentum improving while weekly stays negative can produce sharp two-way swings; risk management may prioritize clearer invalidation levels and smaller sizing until the weekly picture improves.
- Dominance as a tell: Rising BTC dominance suggests capital is behaving defensively. A breakout-led bull leg often coincides with either (a) BTC leading first with strong inflows, or (b) later rotation into alts—right now the market looks closer to stage (a) than broad risk-on.
- Stablecoin “dry powder” constraint: SSR rising (to 10.621) implies BTC is becoming more expensive relative to stablecoin liquidity; sustainable upside may need new stablecoin inflows or fresh leverage/liquidity.
- Profit-taking risk building: NUPL up (0.2422) indicates more holders are in profit—supportive for confidence, but it can also increase sell pressure on rallies if momentum stalls.
- Constructive but not decisive exchange signal: Continued net outflows can reduce immediate sell pressure; however, without a pickup in demand/participation, outflows alone may not drive a breakout.
📘 Glossary
- Spot Volume: Total trading activity in the spot market; rising volume often confirms demand behind a price move.
- Technical Bounce: A short-term price rebound driven by chart dynamics (support levels, short covering) rather than new fundamental demand.
- Volatility Compression: A period of shrinking price swings that can precede a sharp move once liquidity returns and positions build.
- MACD (Moving Average Convergence Divergence): A momentum indicator; positive/raising readings suggest strengthening momentum, while negative readings can indicate ongoing downside pressure.
- Bitcoin Dominance: BTC’s share of total crypto market capitalization; rising dominance often reflects risk-off behavior within crypto.
- Crypto Fear & Greed Index: A sentiment gauge (0–100); 50 is neutral, lower suggests fear, higher suggests greed.
- SSR (Stablecoin Supply Ratio): BTC market cap relative to stablecoin supply; higher SSR can imply less stablecoin liquidity (“dry powder”) available to buy BTC.
- NUPL (Net Unrealized Profit/Loss): On-chain metric estimating whether holders are in aggregate profit or loss; higher values can signal confidence but also potential profit-taking.
- Exchange Balances / Net Flows: Amount of BTC held on exchanges and the net movement in/out; outflows are often interpreted as reduced near-term selling intent.
- Active Addresses: Count of unique addresses active on-chain; can proxy for network usage and participation.


Comment 0