 News
News  Coin Information
  About us
  Customer Service


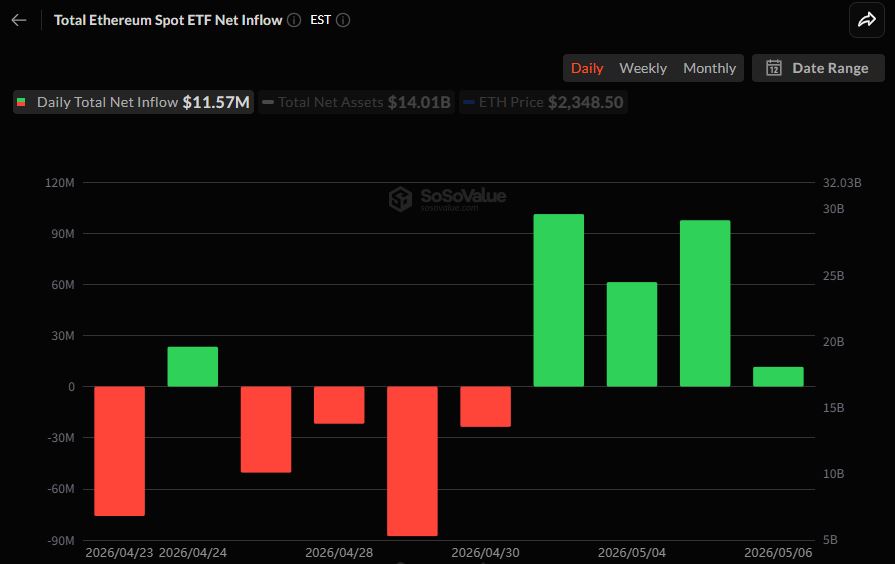
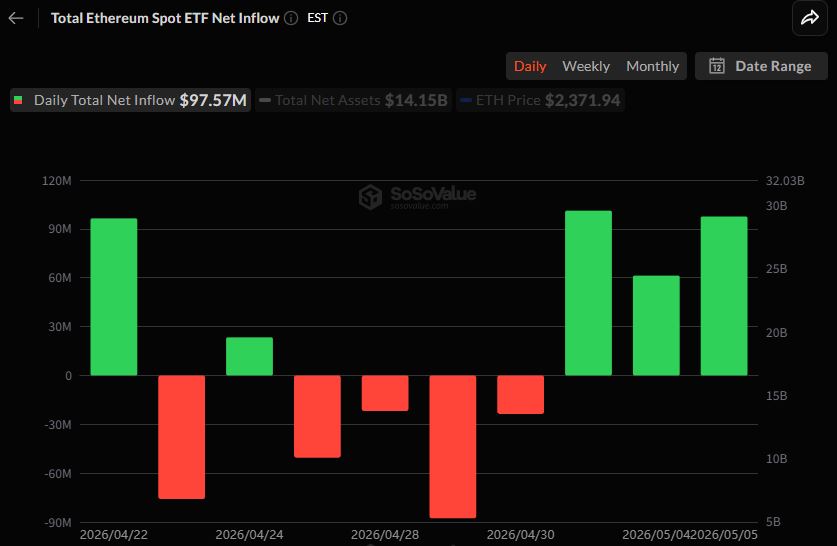
U.S.-listed spot Ethereum (ETH) ETFs extended their streak of net inflows for a fourth consecutive session on May 6 ET, signaling steady 'institutional demand' even as flows remained concentrated in a handful of products.
Data compiled by SoSoValue showed the spot Ethereum ETF complex posted a net inflow of $11.57 million for the day. The run of positive flows has held since May 1, pushing cumulative net inflows to $12.19 billion across the category.
Inflow leadership was narrowly split between two funds. Grayscale’s Ethereum Mini Trust (ETH) attracted $10.03 million, while BlackRock’s iShares Ethereum Trust (ETHA) brought in $2.12 million. Fidelity’s Ethereum Fund (FETH) was the lone product in the red, recording a modest net outflow of $584,260, while the rest of the U.S. spot Ethereum ETF lineup was effectively flat.
Trading activity remained robust, with total daily turnover across the 10 spot Ether ETFs reaching $491.77 million. BlackRock’s ETHA dominated volumes at $346.30 million, followed by Grayscale’s Ethereum Trust (ETH) at $46.59 million and Grayscale’s Ethereum Trust (ETHE) at $42.15 million.
Total net assets held by U.S. spot Ethereum ETFs stood at $14.01 billion, representing roughly 4.94% of Ethereum’s overall market capitalization. By assets under management, BlackRock’s ETHA remained the largest at $7.49 billion, followed by Grayscale’s ETH at $2.14 billion and Grayscale’s ETHE at $1.91 billion.
The latest figures underscore how ongoing allocations into Ether exposure are being driven primarily by the biggest, most liquid issuers—an important dynamic for market structure, as concentrated flows can amplify price sensitivity around ETF creations and redemptions even when headline totals appear moderate.
🔎 Market Interpretation
- Fourth straight inflow day: U.S.-listed spot ETH ETFs added $11.57M on May 6 (ET), extending positive flows since May 1 and reinforcing the narrative of steady institutional participation.
- Flows are highly concentrated: Nearly all net inflows came from Grayscale’s ETH (+$10.03M) and BlackRock’s ETHA (+$2.12M), while most other funds were flat—suggesting demand is issuer- and liquidity-driven, not broad-based across the full ETF set.
- Mixed positioning within the category: Fidelity’s FETH posted a small net outflow (-$584,260), indicating some rotation or product preference rather than uniform buying.
- Liquidity remains strong: Total daily turnover hit $491.77M, with ETHA dominating volumes at $346.30M—a sign that the most liquid vehicles are capturing the bulk of trading and likely guiding short-term price discovery.
- Meaningful market footprint: Spot ETH ETFs hold $14.01B in net assets, about 4.94% of Ethereum’s market cap—large enough that creations/redemptions can influence market microstructure and near-term volatility.
💡 Strategic Points
- Watch the “big two” for marginal demand: Since net flows are mostly coming through ETHA and Grayscale’s products, changes in their daily flow/volume can be a more reliable signal than aggregate ETF headline numbers.
- Concentration can raise sensitivity: When inflows/outflows cluster in a few funds, creation/redemption activity may produce sharper spot-market impact—potentially amplifying ETH’s reaction to macro news, regulatory headlines, or risk-on/risk-off shifts.
- Liquidity preference is a competitive moat: The dominance of ETHA in trading volume suggests tighter spreads and easier execution, which can draw additional institutional routing and reinforce its role as the primary venue.
- Differentiate AUM vs. flow: Track both assets under management (structural allocation) and daily net flows (tactical allocation). AUM leaders (ETHA: $7.49B) may not always lead on flows, but they often set the tone for market expectations.
- Rotation risk inside the complex: Small outflows in one fund while others gain points to product switching (fees, liquidity, issuer preference) rather than outright risk reduction—useful context when interpreting “net” figures.
📘 Glossary
- Spot Ethereum ETF: An exchange-traded fund designed to track ETH’s price using direct ETH holdings (as opposed to futures-based exposure).
- Net inflow/outflow: The day’s cash moving into or out of an ETF after accounting for purchases and redemptions; often linked to share creation/redemption activity.
- Cumulative net inflows: The total net cash added to the ETF category over time, indicating longer-term adoption trends.
- Turnover (trading volume): The dollar value of ETF shares traded in a day; a proxy for liquidity and market participation.
- Net assets / AUM: The market value of assets held by the ETF(s); higher AUM can imply stronger adoption and typically supports better liquidity.
- Creations and redemptions: The mechanism authorized participants use to add/remove ETF shares, which can translate into real buying/selling of the underlying ETH in the spot market.
- Market capitalization: The total value of all circulating ETH; comparing ETF net assets to market cap helps gauge the ETF complex’s influence on the broader market.


Comment 0