

 News
News  Coin Information
  About us
  Customer Service


 Add as a preferred source on Google
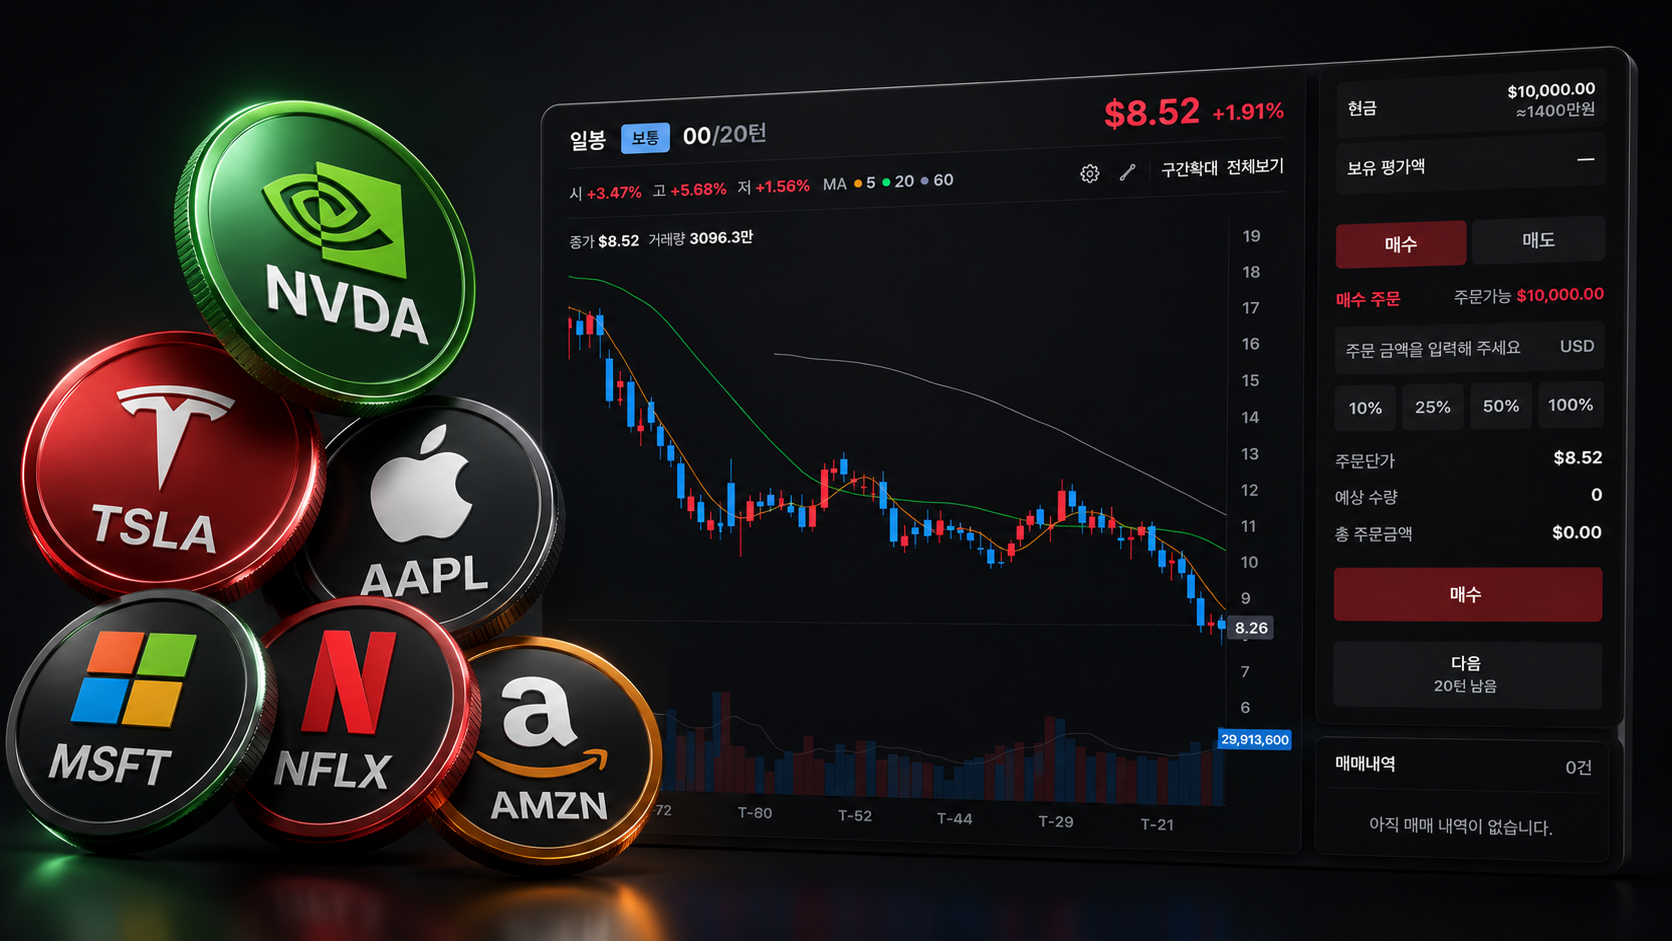
TokenPost has expanded its educational paper-trading product, the ‘Chart Trading Game,’ to include U.S. equities—giving users a new way to test decision-making across both crypto and traditional markets using real historical price action.
The update adds support for 83 U.S.-listed stocks, including Nvidia ($NVDA), Tesla ($TSLA), Apple ($AAPL), and Microsoft ($MSFT). The newly available universe spans semiconductors and mega-cap tech alongside electric vehicles, software, fintech, consumer goods, healthcare, financials, industrials, and other major sectors, broadening the game beyond its original cryptocurrency-only lineup.
According to TokenPost, the U.S. stock dataset is built from the past five years of daily candles, segmented into roughly 800 curated chart intervals. Crypto assets remain available as before, and the game now serves a randomized mix of real historical charts from both markets.
The gameplay format is unchanged: users are shown an authentic historical chart with the asset name and time period hidden. Over 20 turns, they can place buy-and-sell decisions based on observable signals such as price movement, volume, and moving averages. The underlying asset and dates are revealed only after the session ends, recreating the uncertainty of live trading while keeping the experience grounded in real market history.
By introducing U.S. equities, TokenPost is aiming to expose users to market behaviors that differ from crypto’s continuous, 24/7 structure. The company highlighted that stock-specific dynamics—such as ‘gap up’ and ‘gap down’ moves between sessions—are now reflected in the training data, along with historically sharp swings in widely followed names such as Nvidia ($NVDA) and Netflix ($NFLX).
To align with U.S. equity support, the game’s virtual currency and chart pricing have been switched to U.S. dollars (USD). Order screens and portfolio views also display an estimated Korean won (KRW) conversion to help users quickly contextualize position sizes and performance.
After a game ends, an AI-generated review evaluates the user’s trade history, highlighting buy-and-sell timing, recurring behavioral patterns, and performance versus the market. Subscribers can access a deeper AI report that compares results against simplified trading approaches, enabling players to revisit how their decisions were formed—an increasingly common feature as trading platforms incorporate ‘behavioral analytics’ into learning tools.
A TokenPost representative said the addition of U.S. stocks allows users to directly experience distinct price flows and volatility profiles across markets, adding that the company plans to expand the product with more asset classes and learning features to help users practice investment judgment.
The ‘Chart Trading Game’ is available via a TokenPost account, and non-members can try it in guest mode. TokenPost emphasized that the product uses historical data for educational purposes only: the in-game funds are not real assets and cannot be exchanged, and the AI analysis and reports are intended as reference material rather than investment advice or a guarantee of returns.
🔎 Market Interpretation
- Product expansion signals cross-market learning demand: TokenPost’s Chart Trading Game is moving from crypto-only to a blended crypto + U.S. equities training environment, reflecting growing interest in practicing decision-making across different market structures.
- U.S. equity microstructure is a key differentiator: Unlike 24/7 crypto trading, U.S. stocks introduce session-based behavior (open/close effects) and overnight gaps, which can materially change risk, entries/exits, and stop management.
- Broader sector coverage increases pattern diversity: Adding 83 U.S.-listed stocks across mega-cap tech, semiconductors, EVs, fintech, consumer, healthcare, financials, and industrials increases exposure to varied volatility regimes and catalysts.
- Dataset design emphasizes realistic repetition and variety: Five years of daily candles segmented into ~800 curated intervals suggests users will repeatedly encounter historically meaningful setups rather than purely random windows.
- Behavioral analytics is becoming standard in learning tools: Post-game AI reviews and subscriber deep-dives mirror an industry trend of using behavioral feedback (timing, consistency, biases) to improve training outcomes rather than focusing only on P/L.
💡 Strategic Points
- Practice “blind chart reading” to reduce narrative bias: Hiding the ticker and dates forces decisions to rely on observable signals (trend, momentum, volume, moving averages) instead of brand sentiment or news-induced anchoring.
- Adapt strategy to market hours: In U.S. equities, consider how closes affect exposure—holding positions overnight introduces gap risk; intraday-style decisions can behave differently than in crypto’s continuous market.
- Account for gap dynamics explicitly: Test rules for gap-ups/gap-downs (e.g., waiting for first pullback, using wider stops, reducing size pre-close) and compare results versus continuous-market assumptions.
- Use the mixed-market randomization to stress-test consistency: A randomized blend of crypto and stocks can reveal whether a user’s edge is robust or overly dependent on one market’s volatility and liquidity characteristics.
- Leverage AI review as a feedback loop: Focus on recurring behaviors flagged by the review—late entries, premature profit-taking, averaging down, or overtrading—and set one improvement goal per session.
- Benchmark against simplified strategies: The subscriber report’s comparison to simplified approaches can help determine whether performance comes from decision quality or chance, and whether complexity is adding value.
- Interpret P/L in context: Because charts are historical and randomized, evaluate process metrics (rule adherence, drawdown control, entry/exit discipline) alongside outcomes.
- Localization improves usability for KRW users: Switching the in-game unit to USD while showing estimated KRW conversions reduces mental friction when assessing sizing and performance, especially for Korean users.
- Understand educational limits: Results are from historical data and simulated funds; AI output is informational and not investment advice—use it to refine decision-making, not to extrapolate guaranteed returns.
📘 Glossary
- Paper trading: Simulated trading with virtual funds to practice strategies without financial risk.
- Candles / daily candles: Price bars summarizing open, high, low, close (and often volume) for a set period; here, one trading day.
- Chart interval: A selected slice of historical price action used for gameplay; TokenPost curates ~800 intervals from five years of data.
- Moving average (MA): A trend-following indicator that smooths price data (e.g., 20-day, 50-day averages) to help identify trend direction and potential support/resistance.
- Volume: The amount traded in a period; often used to confirm breakouts, reversals, or trend strength.
- Gap up / gap down: When a stock opens significantly higher/lower than the prior close, commonly due to overnight news or order imbalances.
- Volatility profile: How strongly and how often an asset’s price fluctuates; differs across sectors and between stocks vs crypto.
- Behavioral analytics: Analysis of a trader’s actions (timing, risk-taking, consistency) to identify habits and biases affecting performance.
- Backtest-like training: Practicing decisions on historical data to evaluate rules and behavior, though it may not fully capture real-time execution and emotion.
- Estimated KRW conversion: A displayed approximate value of USD amounts in Korean won to help users understand sizing and results in familiar terms.














Comment 0