 News
News  Coin Information
  About us
  Customer Service


XRP (XRP) slipped back toward a pivotal weekly support zone on Thursday ET, with traders increasingly focused on whether the token can hold the $1.13 area as macro-driven risk aversion weighs on the broader crypto complex.
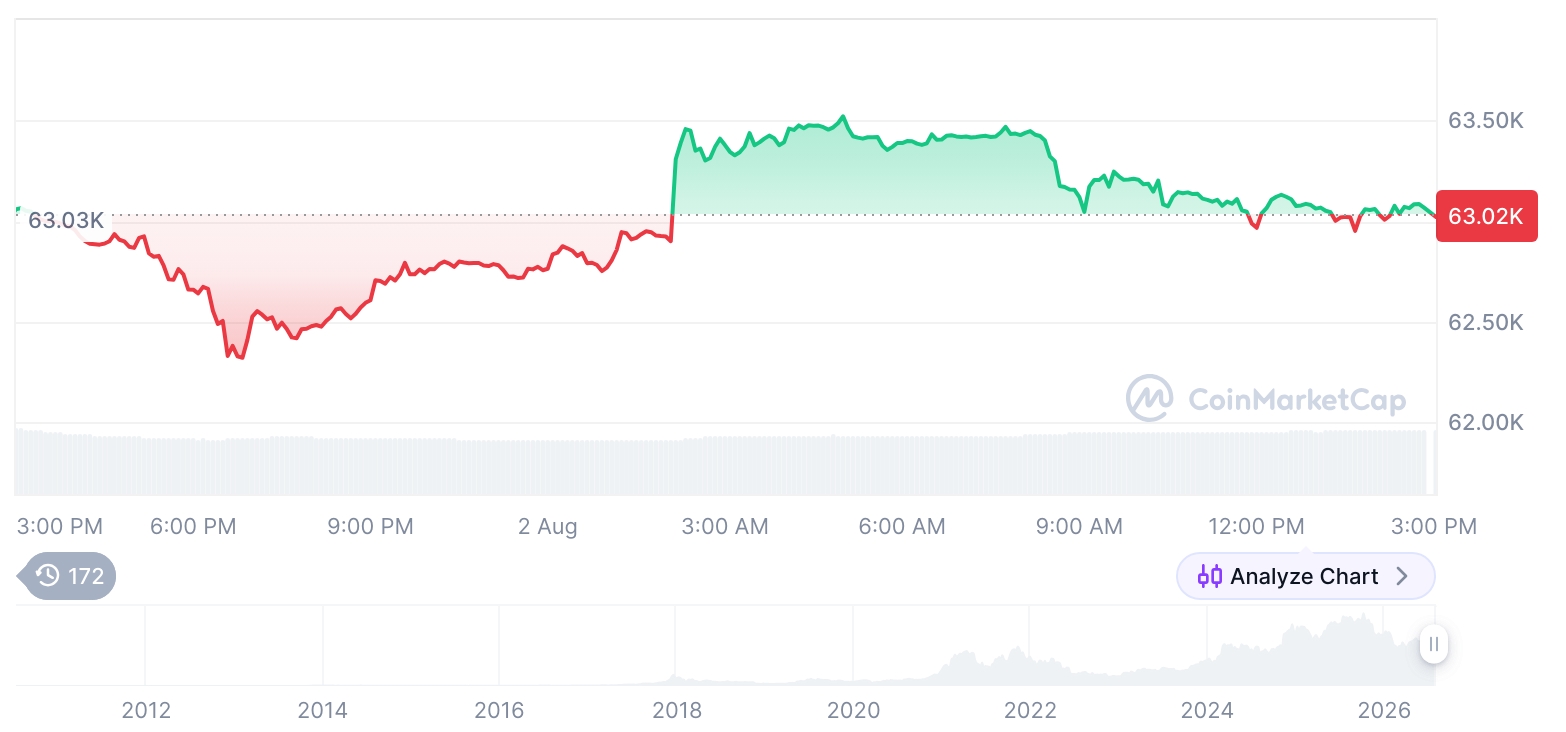
As of Thursday ET, XRP was trading around $1.1283, down 3.21% over the past 24 hours. Losses over the past week totaled roughly 1.36%, extending a grind lower that has left the token under multiple key moving averages. XRP’s market capitalization stood near $70 billion, keeping it ranked sixth among cryptocurrencies by market value, according to CoinMarketCap data referenced in market coverage.
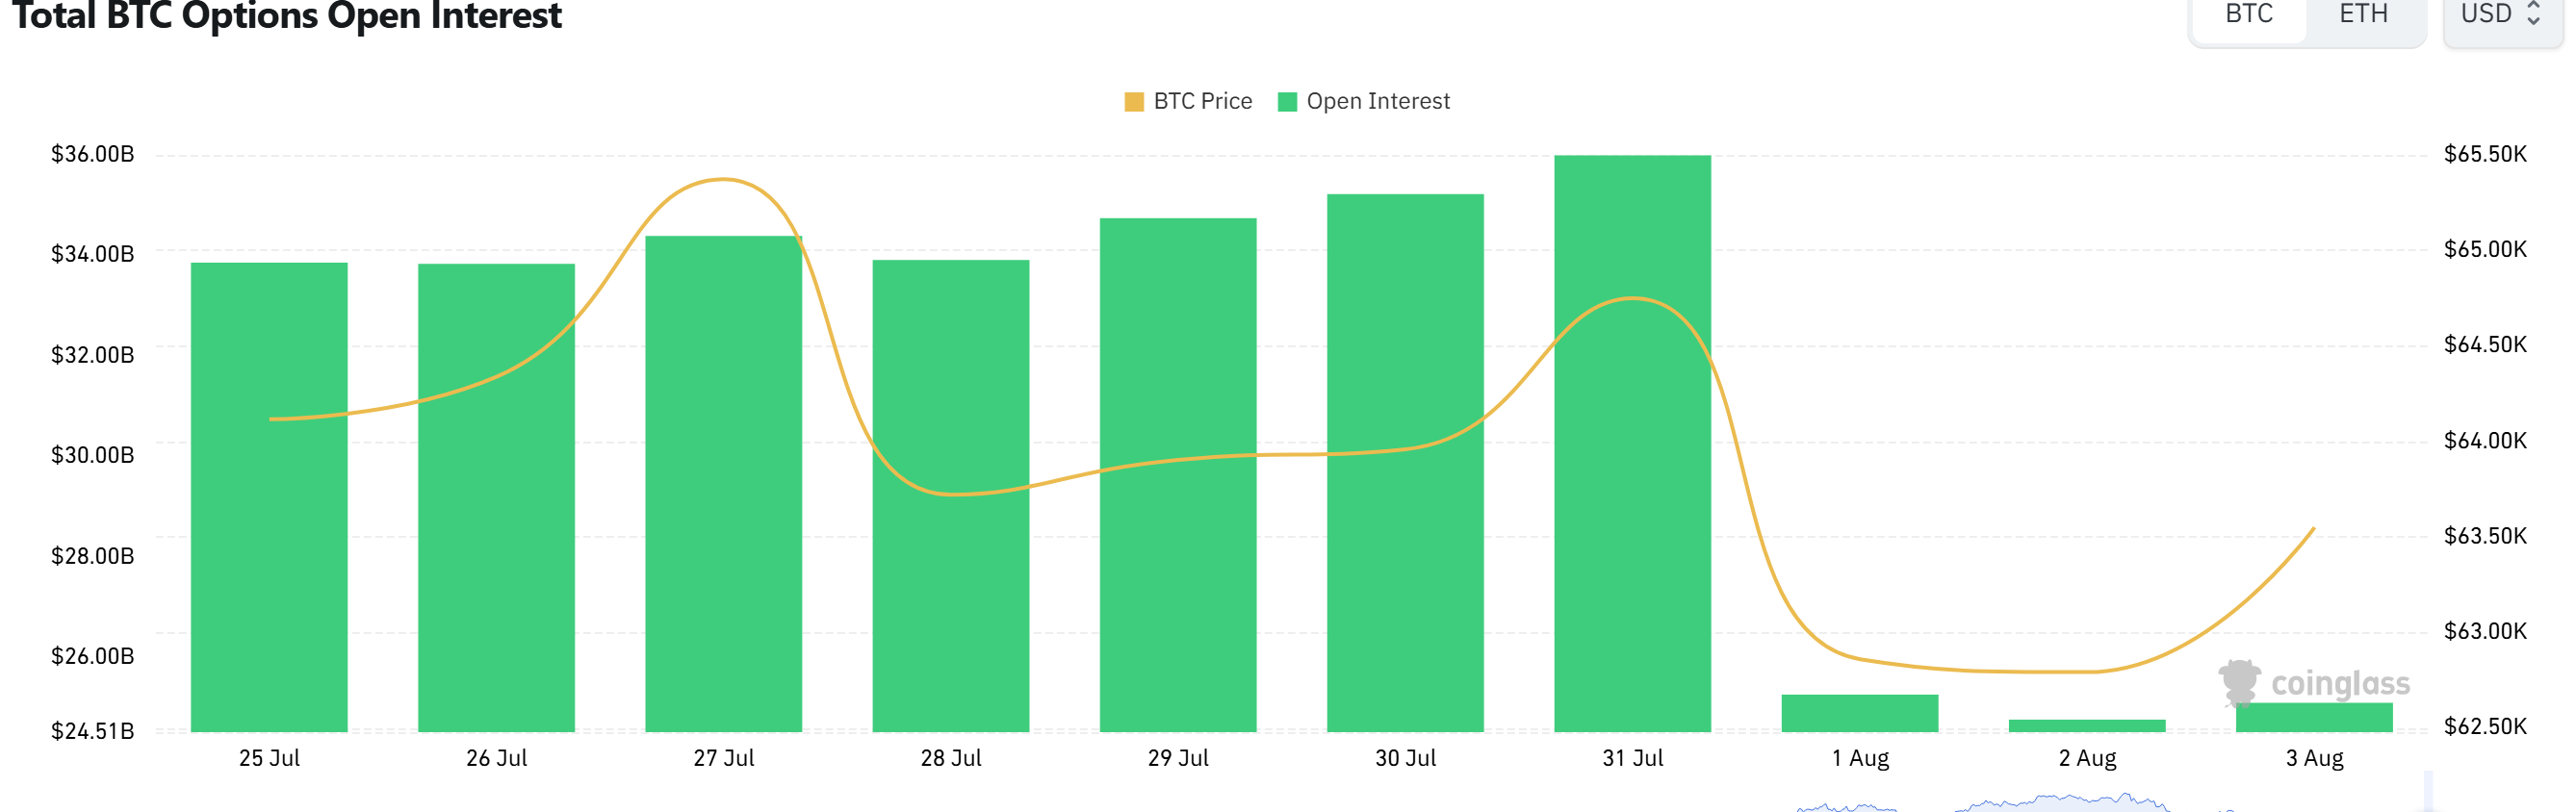
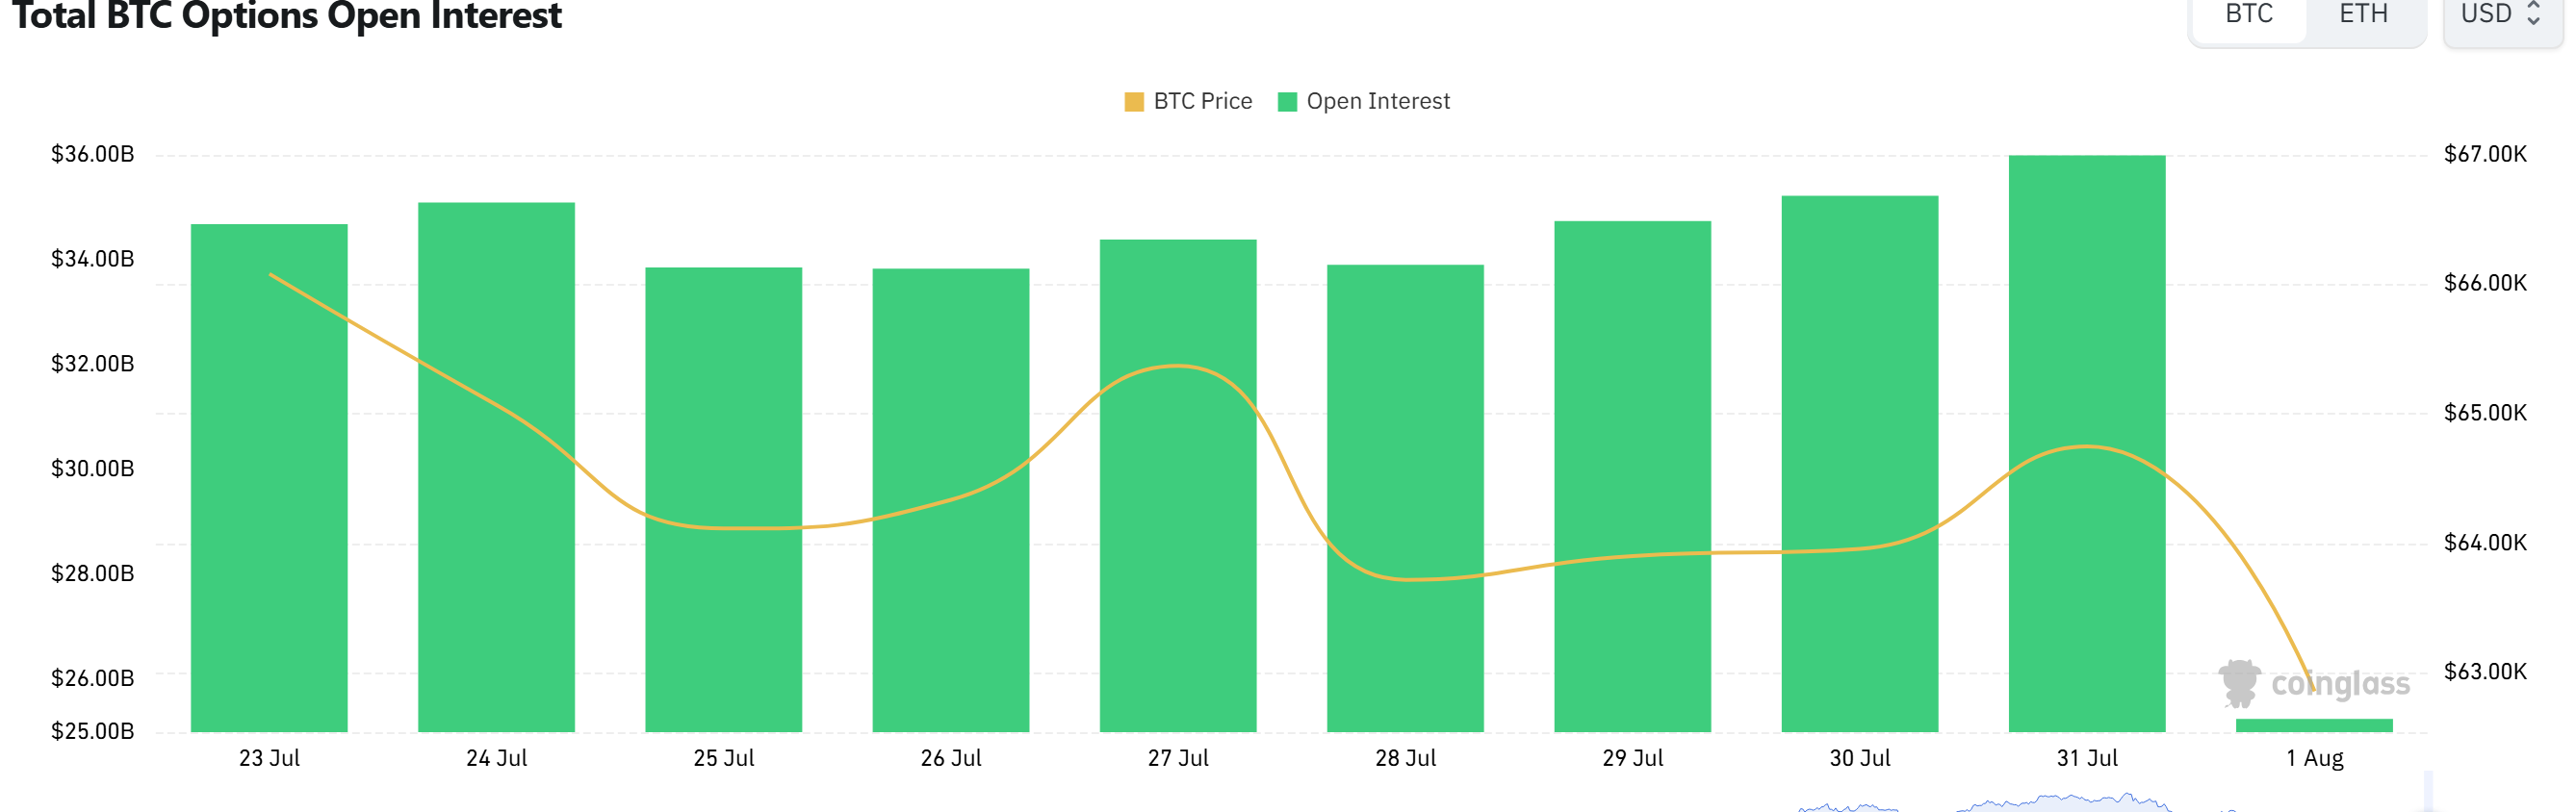
Analysts framed the move as primarily a macro event rather than a Ripple-specific shock. The latest bout of selling followed renewed concerns that the U.S. Federal Reserve may keep interest rates higher for longer, reinforcing a ‘risk-off’ environment across risk assets. Bitcoin (BTC) also fell during the same window, adding pressure to altcoins as correlations tightened and traders reduced exposure.
Bitget, a major global crypto exchange, said XRP had already met the upside target implied by a prior double-bottom formation near $1.29 before reversing. “After reaching the double-bottom target of $1.29, XRP retreated by about 5.33% to the $1.14 area,” Bitget’s research desk noted in commentary cited by local reports, adding that the earlier bullish setup should be considered complete and no longer operative.
Derivatives positioning amplified the downside. Market watchers pointed to a swift contraction in XRP futures activity, with open interest dropping about 14.5% over 24 hours and liquidations totaling roughly $7.41 million. Notably, around $6.59 million of those liquidations came from long positions—an imbalance that suggests a ‘leverage flush,’ where forced closures of overextended bets accelerate the decline.
From a technical perspective, several indicators underscore the fragility of the current range. Bitget highlighted $1.13 as the most important support on the weekly chart, warning that a decisive break could expose XRP to a deeper slide toward the $0.90–$1.00 band. Separately, U.Today reported that XRP has broken lower from a descending triangle structure that had been forming for months, accompanied by stronger sell-side volume.
XRP is also trading below its 50-day, 100-day, and 200-day moving averages, with the cluster of these trend lines around $1.30 now acting as a stiff overhead barrier. Momentum gauges remain subdued: the relative strength index (RSI) was cited in the mid-40s, a level typically interpreted as weak-to-neutral rather than outright oversold—leaving room for further downside if broader market sentiment deteriorates.
For bulls, analysts broadly converged on the need to reclaim $1.20 as an initial step toward rebuilding a recovery narrative. The $1.20–$1.30 zone, once viewed as support, has increasingly flipped into resistance. A sustained move above $1.30 would be more meaningful in signaling renewed demand, but that scenario depends on stabilization in derivatives—particularly whether open interest stops falling and long-liquidation pressure eases.
Importantly, observers did not identify any immediate fundamental catalyst behind the selloff. Reports noted no major new Ripple partnerships, protocol upgrades tied to the XRP Ledger (XRPL), or sudden regulatory developments driving the move. Separately, speculation about an “XRP Miami” conference was described as unsubstantiated, with the Miami Beach Convention Center schedule not showing such an event for June 2026.
With XRP hovering near a widely watched inflection point, market attention is likely to remain on the $1.13 level and on upcoming U.S. inflation data and Federal Reserve communications for cues on the rate path. A clear shift toward easing financial conditions could revive ‘risk appetite’ across crypto markets, while persistently hawkish signals could keep pressure on XRP and leave the $1.00 area in play.
🔎 Market Interpretation
- Price at a key inflection: XRP is sliding toward a major weekly support near $1.13, trading around $1.1283 (-3.21% 24H), with the market focused on whether this level holds.
- Macro risk-off is the main driver: Selling pressure is framed as Fed “higher for longer” fears rather than XRP/Ripple-specific news, with Bitcoin weakness tightening correlations and pressuring altcoins.
- Prior bullish pattern has “played out”: Bitget notes XRP already reached the double-bottom target near $1.29 and then reversed, implying the earlier bullish setup is no longer active.
- Derivatives deleveraging accelerated the drop: XRP futures open interest fell ~14.5% in 24 hours alongside ~$7.41M liquidations, heavily skewed to long liquidations (~$6.59M), consistent with a leverage flush.
- Trend condition remains weak: XRP is below the 50/100/200-day moving averages, with the MA cluster around $1.30 acting as strong overhead resistance; RSI in the mid-40s signals weak-to-neutral momentum, not oversold.
- No immediate fundamental catalyst: No major Ripple partnerships, XRPL upgrades, or regulatory headlines were cited; “XRP Miami” conference chatter is described as unsubstantiated.
💡 Strategic Points
- Primary support to watch: $1.13 (weekly). A decisive breakdown increases odds of a move into the $1.00 psychological area and potentially the $0.90–$1.00 zone.
- Near-term recovery requirement: Bulls need to reclaim $1.20 to begin rebuilding structure; this area is now a pivot as former support has turned into resistance.
- Key resistance band: $1.20–$1.30 is the main supply zone; a sustained move above $1.30 would be a more meaningful signal of renewed demand given it aligns with multiple moving averages.
- Derivatives confirmation checklist: Watch for open interest stabilization and a reduction in long-liquidation dominance; continued OI declines may indicate ongoing risk reduction rather than dip-buying.
- Pattern risk: Reports cite a breakdown from a descending triangle with stronger sell volume—often interpreted as bearish continuation unless price quickly reclaims the broken range.
- Macro event sensitivity: Upcoming U.S. inflation data and Fed communications are key catalysts; easing expectations could lift risk appetite, while hawkish signals keep downside pressure elevated.
- Risk framing: With RSI not oversold and trend under major MAs, bounces may face selling unless macro conditions improve and spot/derivatives flows turn supportive.
📘 Glossary
- Weekly support: A price level repeatedly defended on weekly charts; a break often signals a larger trend shift.
- Risk-off: A market regime where investors reduce exposure to volatile assets (e.g., crypto) in favor of safer holdings.
- Double-bottom: A bullish reversal pattern with two similar lows; its “target” is often measured from the neckline to project upside.
- Descending triangle: A pattern with lower highs compressing into flat support; a downside break is commonly seen as bearish continuation.
- Moving averages (50/100/200-day): Trend indicators; trading below them typically reflects bearish/weak trend, while they can become resistance on rebounds.
- RSI (Relative Strength Index): Momentum oscillator (0–100); ~50 is neutral, below 50 is weaker momentum, below ~30 often considered oversold.
- Futures open interest (OI): Total outstanding futures contracts; falling OI can indicate position unwinding/deleveraging.
- Liquidation: Forced closure of leveraged positions when margin requirements aren’t met; can intensify price moves.
- Leverage flush: A rapid cascade of liquidations that accelerates a move as over-leveraged positions are forcibly closed.
- Support flipping to resistance: A former floor that, once broken, becomes a ceiling where sellers tend to reappear.


Comment 0